What Is Solid Phase Peptide Synthesis? a Clear Guide
Solid phase peptide synthesis is a method that builds a peptide one amino acid at
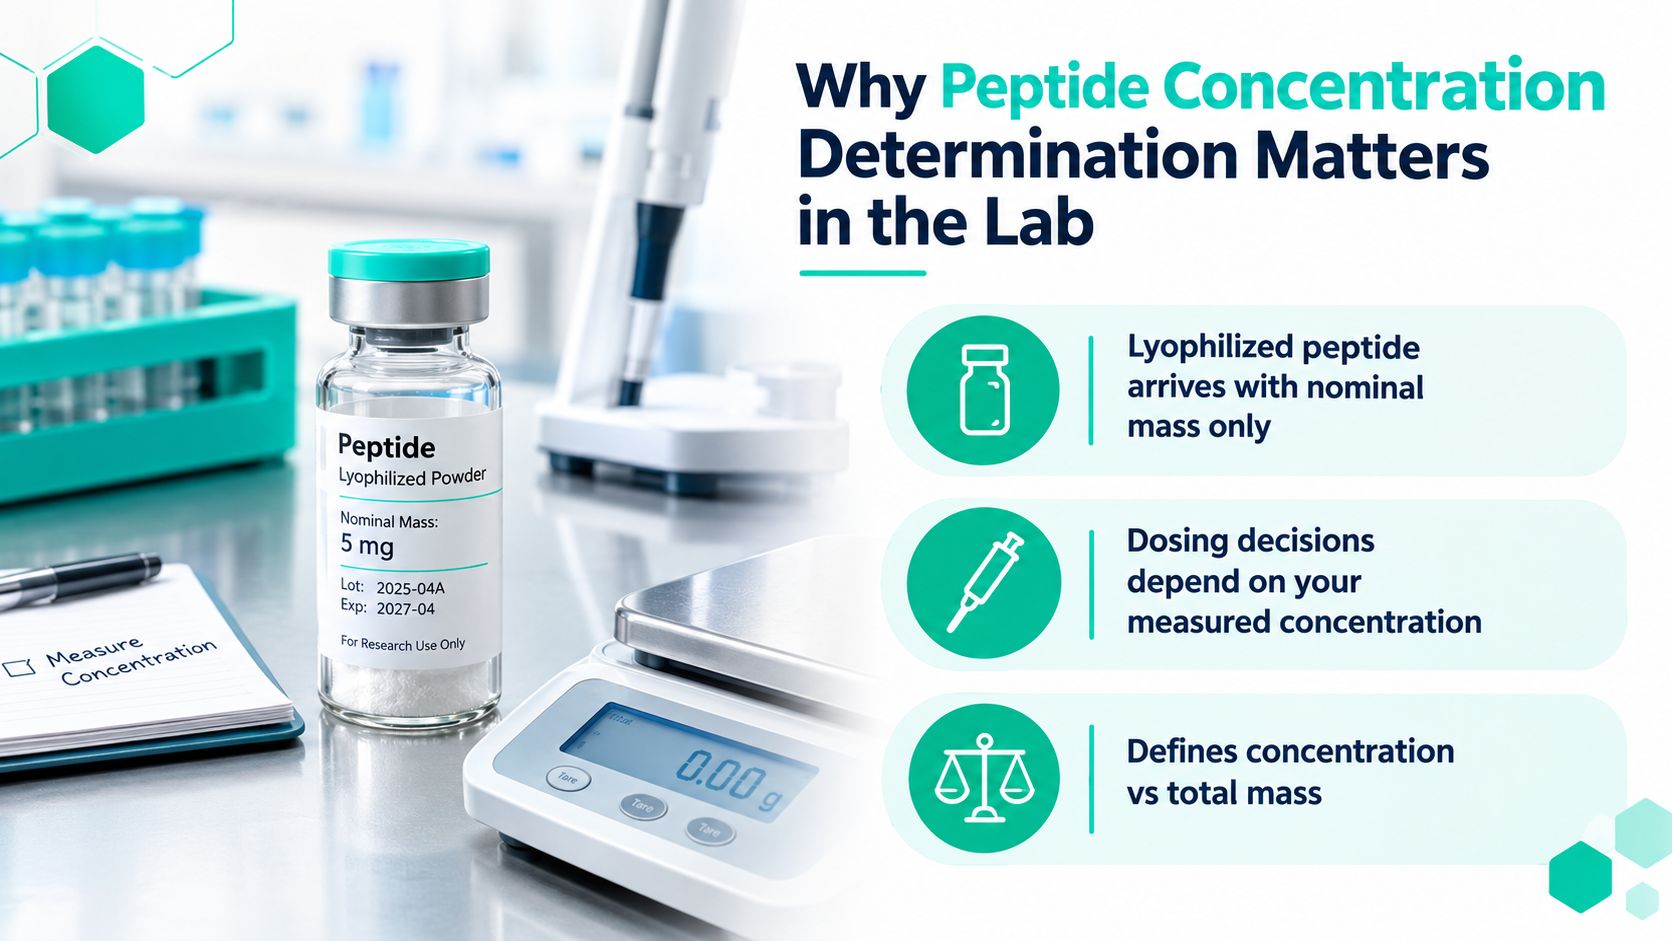
A lyophilized peptide vial arrives with a labeled mass, but no concentration you can use directly at the bench. You weigh or reconstitute it, record the solvent volume, and then face the uncomfortable question: does the calculated value represent target peptide, or everything that came out of the vial? Your next dosing step, assay setup, or dilution series depends on that distinction.
Peptide concentration determination sits between a convenient textbook calculation and a more demanding absolute assay. Beer-Lambert UV analysis is fast, but it depends on sequence, solubility, and clean optical behavior. Amino acid analysis is the reference approach, but it requires specialized preparation and instrumentation. Quantitative HPLC and colorimetric assays fill useful middle positions, provided you understand what each one measures.
The mass printed on a vial describes the material supplied, not necessarily the molar amount of intact target peptide. A synthetic peptide can be present as a salt, can retain moisture, and can contain residual formulation materials. Counterions such as TFA and adsorbed water increase gross mass without contributing an equivalent amount of target peptide. Peptide purity and peptide content are different measurements, so a high HPLC purity value alone doesn't establish the concentration of the active molecular species.
That distinction matters whenever you convert a mass-based preparation into molar dosing. A solution reported in milligrams per milliliter describes total weighed material divided by volume. A solution reported in moles per liter depends on the molecular mass and the actual amount of target peptide. Counterions and hydration change the relationship between those two descriptions.
Before choosing an assay, check the sequence, molecular form, certificate, stated purity, and solvent compatibility. Confirm whether the product is supplied as a free peptide or a salt, and note whether the sample dissolves completely. A cloudy solution, visible precipitate, or film on the vial can invalidate an otherwise correct calculation.
A practical record should distinguish three values:
The four method families used most often are UV absorbance at 280 nm, colorimetric protein assays, quantitative HPLC, and amino acid analysis. UV is attractive when the peptide is soluble and contains useful chromophores. Colorimetric assays can support rapid screening, but their response depends on chemistry and buffer compatibility. HPLC separates the target from related species and can support both concentration and purity assessment. AAA measures amino acid composition after hydrolysis and is valuable when an absolute result is needed.
For background on the material itself, review this overview of research peptides and their laboratory handling. The right method isn't the most advanced instrument available. It's the method whose assumptions match the sample you have.
A280 works well when the peptide is soluble, the solution is clear, and the sequence contains aromatic residues that provide a useful extinction coefficient. The governing relationship is the Beer-Lambert law:
A = ε × l × c
Here, A is absorbance, ε is the molar extinction coefficient in M⁻¹ cm⁻¹, l is the optical path length in centimeters, and c is molar concentration. Rearranging gives:
c = A / (ε × l)
For a peptide containing tryptophan, tyrosine, and cysteine, calculate ε280 from the residue composition using an accepted sequence-based method such as Edelhoch or Pace. A commonly used residue-input table is:
| Residue | ε280 (M⁻¹ cm⁻¹) | Notes |
|---|---|---|
| Tryptophan | 5560 | Strong aromatic contributor |
| Tyrosine | 1200 | pH and environment can influence the signal |
| Cystine | 125 | Use the appropriate oxidized sulfur contribution |
| Cysteine | Sequence and state dependent | Don't substitute cystine values for free cysteine without checking the calculation |
The values above are commonly used for sequence-based A280 calculations, but the practical issue is not the arithmetic. It's whether the assumed molecular form exposes the relevant chromophores and whether the sample contributes background absorbance.
Assume a clear peptide solution gives A280 = 0.50 in a 1 cm path-length cell. Suppose the sequence contains one tryptophan and two tyrosines, giving:
ε280 = 1 × 5560 + 2 × 1200 = 7960 M⁻¹ cm⁻¹
The molar concentration is:
c = 0.50 / (7960 × 1) = 6.28 × 10⁻⁵ M
To convert to mass concentration, multiply by the peptide molecular weight. If the molecular weight is represented as MW, then:
mg/mL = c × MW
If the aliquot was diluted before reading, multiply the measured concentration by the dilution factor. In a spreadsheet, keep separate columns for absorbance, path length, extinction coefficient, dilution factor, molecular weight, molar concentration, and mass concentration. That makes it easier to identify whether an unexpected result came from the instrument or from a transcription error.
You can use a peptide concentration calculator to check the arithmetic, but the calculator can't determine whether the sample is aggregated, incompletely dissolved, or contaminated.
Turbidity is a major warning sign. Suspended particles scatter light and can increase the apparent absorbance. A nucleic-acid contribution may also become apparent when you inspect the broader UV spectrum, especially around 260 nm. A cuvette with the wrong path length, an incorrect blank, or a sample that exceeds the instrument's linear range can produce a precise-looking but indefensible number.
Before reporting A280, check the following:
UV is a method, not a guarantee. Its value depends on the peptide meeting its assumptions.
Colorimetric assays are useful when the laboratory needs a quick estimate and the sample matrix is familiar. BCA, Bradford, and Lowry-style methods convert a chemical response into an apparent protein or peptide concentration. They don't separate the target peptide from related sequences, and their response can vary with amino acid composition and formulation components.
Quantitative HPLC takes a different approach. It separates the peptide chromatographically, detects the target peak, and converts peak area into concentration through an external calibration curve or a validated reference standard. That extra specificity usually costs more instrument time and method development, but it also gives you a chromatogram that can reveal related species rather than hiding them inside a single colorimetric signal.
| Attribute | BCA | Bradford | Quantitative HPLC |
|---|---|---|---|
| Speed | Fast for routine batches | Fast for screening | Slower because of preparation and separation |
| Throughput | High when the matrix is compatible | High when standards behave consistently | Moderate, dependent on run time and autosampler capacity |
| Equipment | Plate reader or spectrophotometer | Plate reader or spectrophotometer | HPLC or UHPLC with suitable detector |
| Peptide specificity | Limited and composition dependent | Limited, with dye-binding variation | Higher because the target is separated |
| Buffer tolerance | Can be affected by reducing agents and chelators | Sensitive to detergents and formulation conditions | Matrix effects still require validation |
| Purity information | No direct separation profile | No direct separation profile | Peak pattern supports purity assessment |
BCA is convenient for a discovery lot when the same peptide and buffer are tested repeatedly against a suitable calibration material. It becomes less reliable when the peptide's amino acid composition differs substantially from the protein standard or when reducing chemistry contributes to the signal. Small synthetic peptides can therefore produce an apparent concentration that doesn't track target-peptide mass cleanly.
Bradford assays are often chosen because they're simple and fast, but the dye response depends strongly on the sequence and the surrounding matrix. Detergents, organic solvents, and unusual formulation components can shift the response. Lowry-style methods face their own chemical interferences and are rarely the first choice for a difficult synthetic-peptide matrix.
With quantitative HPLC, prepare standards that bracket the expected sample response, inject them under the same conditions, and build a calibration relationship from peak area to concentration. Then inspect the sample chromatogram for the target peak, shoulders, degradation products, and unexpected peaks. A suitable workflow should also evaluate recovery, repeatability, carryover, blank response, and matrix interference.
Use HPLC chromatogram interpretation guidance when reviewing peak identity and integration. Choose colorimetry for speed, HPLC for specificity, and don't treat either result as absolute until the method has been shown to behave in your matrix.
Amino acid analysis, or AAA, answers a different question from UV and colorimetric testing. Instead of inferring peptide amount from an optical response, AAA hydrolyzes the peptide into constituent amino acids and quantifies the resulting building blocks against external standards. That makes it the best-practice reference when the sample contains non-peptide material or when other methods disagree.
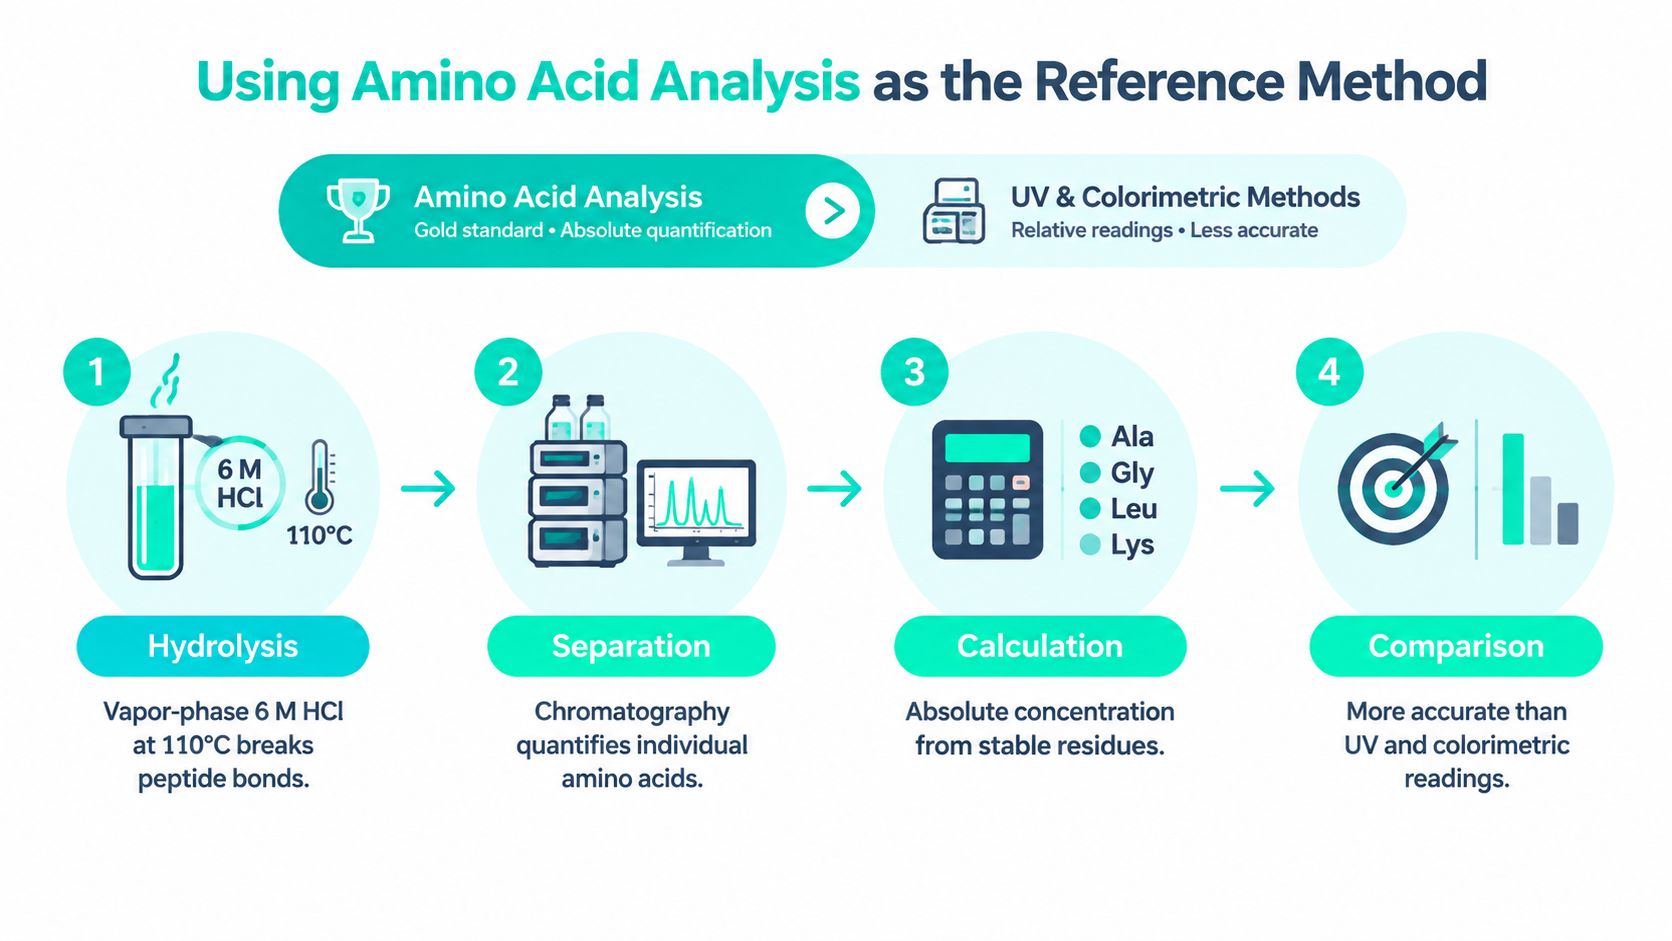
A conventional workflow uses vapor-phase 6 M HCl at 110 °C for 18–24 hours to break peptide bonds. The hydrolysate is then separated and detected by post-column ninhydrin chemistry or by pre-column derivatization such as AccQ-Tag. Integrated amino acid peaks are compared with calibrants, producing an amount for selected residues.
Hydrolysis isn't neutral for every residue. Asn and Gln can convert during acid treatment, while Cys and Trp may require special handling, correction factors, or alternative protocols. The analyst therefore selects stable residues that are present in known numbers and uses the measured amount of those residues to back-calculate intact peptide amount.
Practical rule: Choose more than one suitable residue when the sequence allows it. Agreement between independent residue calculations is more informative than a single peak.
Consider a 20-residue peptide with known Leu and Ala composition. Hydrolyze a dried aliquot, compare the Leu and Ala peak areas with external amino acid standards, and convert each response to pmol using the calibration curves. If the Leu-based and Ala-based calculations agree after accounting for hydrolysis behavior and recovery, use the known residue stoichiometry to estimate the amount of intact peptide in the aliquot.
Divide that peptide amount by the original sample volume to obtain molar concentration. Multiply by molecular weight when a mass concentration is required. The calculation is only as defensible as the aliquot record, hydrolysis recovery, calibration, and residue selection.
AAA is slower and more resource intensive than a direct UV reading, but it resolves the central problem created by salts, moisture, and non-target material. When A280 suggests one value and quantitative HPLC suggests another, AAA can establish which result better represents actual peptide content. It also helps distinguish target-sequence purity from total peptide content, a distinction that matters for dosing and formulation work.
The following video provides visual context for amino acid analysis workflows:
A280 is often the first method people reach for because the instrument is available and the equation is familiar. The trouble starts when the sequence or sample violates the assumptions behind the equation.
A peptide without Trp or Tyr may have a very weak A280 response. In that situation, baseline noise and small blank differences can dominate the reading. A low extinction coefficient also means that a modest absorbance error becomes a large relative concentration error. A280 doesn't become more reliable because the calculation is easy.
Aggregation creates a second failure mode. Amphipathic or self-assembling peptides can form particles that scatter light, raising the apparent signal. Recent work also shows that fluorescence can vary with peptide concentration in a way connected to self-assembly, which means an optical response may reflect structure as well as amount. This is one reason fluorescence and LC-MS-based approaches are increasingly considered for difficult samples, while expert guidance on UV and peptide quantification emphasizes the limits of sequence-dependent absorbance.
| Pitfall | Root cause | Recommended method |
|---|---|---|
| No aromatic residues | Weak or negligible A280 signal | AAA, quantitative HPLC, or carefully developed A205 |
| Aggregation or turbidity | Light scattering and structure-dependent signal | Improve solubilization, then use HPLC, AAA, or LC-MS |
| Related peptide impurities | Co-measured absorbance | Quantitative HPLC or LC-MS |
| Buffer absorbance | Matrix contributes to the optical reading | Matrix-matched blank and an orthogonal method |
| Salt and moisture in dried material | Gross mass exceeds target-peptide mass | AAA for absolute content |
| Degradation or PTMs | Modified species may retain or lose UV response | LC-MS or quantitative HPLC |
A peptide described as 99% pure can still be unsuitable for concentration determination by dividing vial mass by solvent volume. Purity generally addresses the relative amount of target sequence among peptide-related species. It doesn't by itself quantify residual TFA, moisture, or other non-peptide material.
That distinction is the messy middle ground between certificate review and bench preparation. A purified sample may be excellent for an experiment yet still require AAA or a calibrated HPLC method before you assign an absolute molar concentration. UV can remain useful as a screening measurement, but don't present it as a reference result when the sample is poorly soluble, aggregation-prone, or compositionally complex.
The vial is open, the protocol needs a concentration, and the peptide gives you no useful A280 signal. Start with the sequence before choosing an assay. Count Trp and Tyr, review cysteine state, inspect termini and modifications, and estimate whether the calculated ε280 can produce a measurable response. If ε280 is below 1000 M⁻¹ cm⁻¹, treat A280 as a poor primary method. Use A205 with an appropriate sequence correction, quantitative HPLC, or AAA instead of assigning precision to a weak reading.
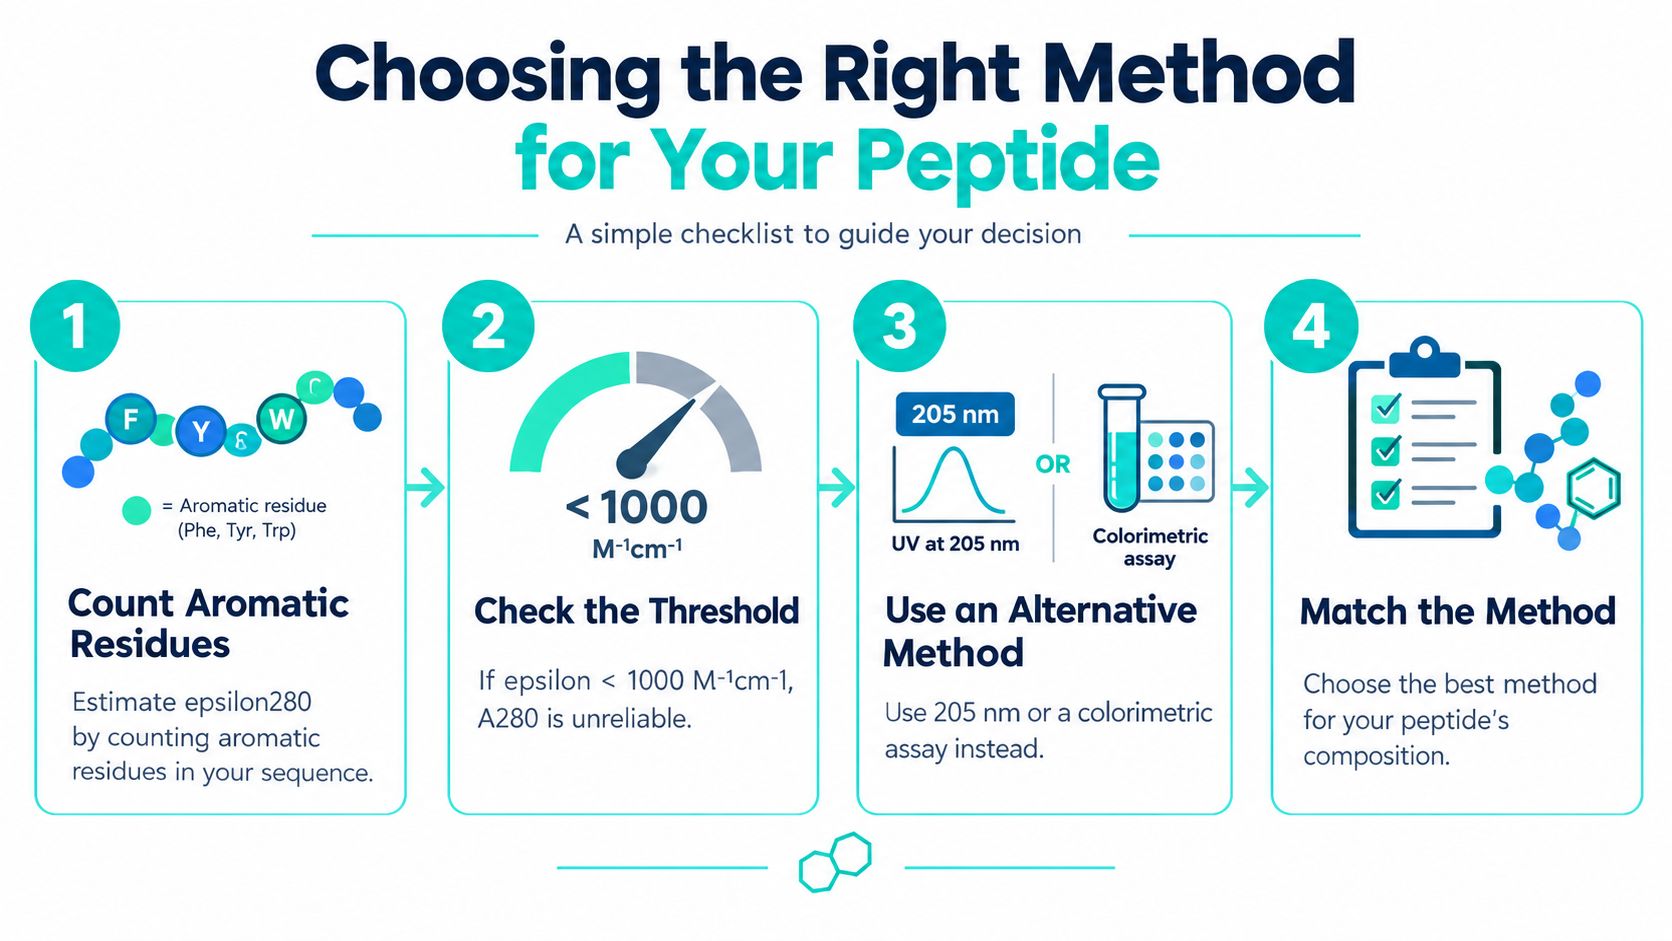
A clear, soluble, well-characterized peptide with useful aromatic residues is a reasonable UV candidate. Match the blank to the buffer, verify the path length, and inspect the full spectrum rather than recording one wavelength without context. Aggregation, haze, or time-dependent drift can make the apparent concentration reflect scattering or changing solubility.
A crude or visibly mixed sample needs separation. Quantitative HPLC can distinguish the principal peptide peak from truncated sequences, degradation products, and other UV-active components. If peptide content must be established independently of chromatographic response, AAA provides the stronger reference.
Colorimetric assays suit a narrower task. They can screen desalted material quickly when the matrix is compatible and the response has been checked against an appropriate standard. Treat the result as assay-dependent, not as an absolute value because it was obtained rapidly.
| Bench question | First choice | Escalate when |
|---|---|---|
| Do I need a quick estimate for exploratory work? | UV or compatible colorimetric assay | The sample is cloudy, weakly absorbing, or matrix-heavy |
| Is the sample composition uncertain? | Quantitative HPLC | Related peaks or response factors remain unresolved |
| Do I need a defensible absolute value? | AAA | Residue recovery or hydrolysis behavior requires method development |
| Does the peptide aggregate? | HPLC, AAA, or LC-MS | Solubilization changes the measured response |
| Does the peptide lack aromatic residues? | A205, HPLC, or AAA | Baseline and buffer absorbance remain problematic |
Before opening the vial, record the decision criteria:
For an aggregation-prone peptide or one lacking Trp or Tyr, ask the supplier whether AAA or quantitative HPLC data are available for that lot before relying on A280. Celonyx Labs lists research peptides through its online catalog. That catalog information supports material selection, while the concentration method still needs to match the peptide's sequence, physical behavior, and reporting requirement.
Treat concentration as a controlled analytical result, not a number copied into a protocol. Another analyst should be able to reconstruct the preparation, inspect the raw signal, and understand why the reported value was accepted.
Record the sample identifier, lot, sequence, molecular form, nominal mass, weighing information, solvent, dilution steps, and final volume. Include the instrument identification, operator, analysis date, software version, and raw absorbance or chromatogram files. For HPLC, retain the calibration reference, injection volume, integration settings, response factor, blank results, and system suitability information. For UV, record path length, blank correction, extinction coefficient, wavelength, and dilution factor.
A strong QC record separates nominal, theoretical, purity-adjusted, and measured concentration. Don't overwrite an original calculation when a repeat analysis changes the result. Preserve both values, document the reason for the repeat, and identify which result is reportable.
Include replicate readings or injections, the mean, standard deviation, acceptance criteria, and any uncertainty language required by your laboratory procedure. If AAA was used, record hydrolysis conditions, selected amino acids, calibrant information, recovery assumptions, and any residue-specific limitations.
Note turbidity, precipitation, incomplete dissolution, adsorption concerns, carryover, failed blanks, unstable baselines, and unexpected chromatographic peaks. A solution that required denaturation or an altered solvent system may not be directly comparable with a result from the intended formulation buffer.
Use a version-controlled template with reviewable electronic approvals and restricted editing rights. Keep certificates for reference standards and reagents with the analytical record. The final file should let a colleague repeat the method, evaluate whether storage affected the result, and determine whether a method transfer preserved the original assumptions.
The most defensible peptide concentration determination is not necessarily the fastest one. It's the result supported by a clear chain from vial, to preparation, to raw measurement, to calculation, and finally to a stated decision.
Celonyx Labs offers research peptides through its online catalog, with product information and stated third-party testing that can support material selection before you build a concentration workflow. Visit Celonyx Labs to review available research peptides and contact the team about your laboratory requirements.
Solid phase peptide synthesis is a method that builds a peptide one amino acid at

500 mcg equals 0.5 mg, a labeled research quantity, and no published human study establishes
Choose the best GHK-Cu peptide format for laboratory skin and wound-healing research. Compare documentation, assay
FOR RESEARCH USE ONLY. Products sold by Celonyx Labs are intended exclusively for laboratory and scientific research. They are not intended for human or veterinary use, consumption, diagnosis, treatment, cure, or prevention of any disease. By purchasing from this site, you acknowledge that you understand the intended research purpose of these materials and agree to comply with all applicable laws and regulations.