

5 Amino Acid Peptides: A Practical Lab Guide
A five-residue sequence can look simple on paper, but what exactly does “5 amino acid”

The most popular advice for reading an HPLC chromatogram is also the least reliable: find the largest peak, read the area percentage, and call that the purity. That shortcut ignores what the trace cannot establish on its own. A clean signal doesn't automatically prove molecular identity, true mass fraction, net peptide content, or complete separation from co-eluting components.
A chromatogram is evidence from a particular method, detector, column, sample preparation process, and set of integration rules. Retention time is method-dependent, not a molecular fingerprint, and peak-area percentage describes detected response rather than an automatic measurement of material composition. The practical question isn't “How big is the main peak?” It's “What does this method show, what might it miss, and what evidence supports the conclusion?”
A tidy trace can create false confidence. The baseline looks stable, the principal peak is prominent, and the report may display a reassuring purity figure. Yet an unresolved impurity can sit beneath that peak, integration boundaries can be adjusted manually, and a detector wavelength may respond differently to different components. Visual neatness is useful, but it isn't validation.
That matters when reviewing a peptide Certificate of Analysis or deciding whether research material is suitable for a sensitive assay. A chromatogram may support a purity assessment under its stated conditions, but it doesn't independently prove that the observed peak is the intended sequence. Retention time depends on the column chemistry, mobile phase, gradient, flow conditions, temperature, and other method details. Two compounds can share a retention time under one method, while the same compound can shift under another.
Practical rule: Treat retention time as a method-specific comparison point, not as an identity certificate.
Area percentage is calculated from the signals the detector records. That makes it useful for comparing detected components within a run, but it doesn't automatically equal mass fraction, assay, or net peptide content. Different compounds can produce different detector responses, and a component that co-elutes with the target becomes part of the same integrated area.
This is why a reported purity value should be read with the chromatogram, method conditions, and integration report. If a supplier provides only a summary table, ask for the raw trace and the underlying test details. Guidance on third-party-tested peptides can help frame the broader quality conversation, but third-party testing still needs to be interpreted in the context of the actual analytical method.
A defensible interpretation usually combines several observations:
The right mindset is skeptical without being dismissive. A chromatogram can show how a sample behaved in a defined separation. It can't answer every question about what the sample is.
Start with the axes before looking at any peak. The x-axis shows retention time, generally the elapsed time from injection to detection, while the y-axis shows detector response. In a UV or diode-array trace, that response is commonly expressed as absorbance-related signal. In a mass spectrometric trace, it represents an ion signal such as intensity or extracted-ion response, so the scale has a different analytical meaning.
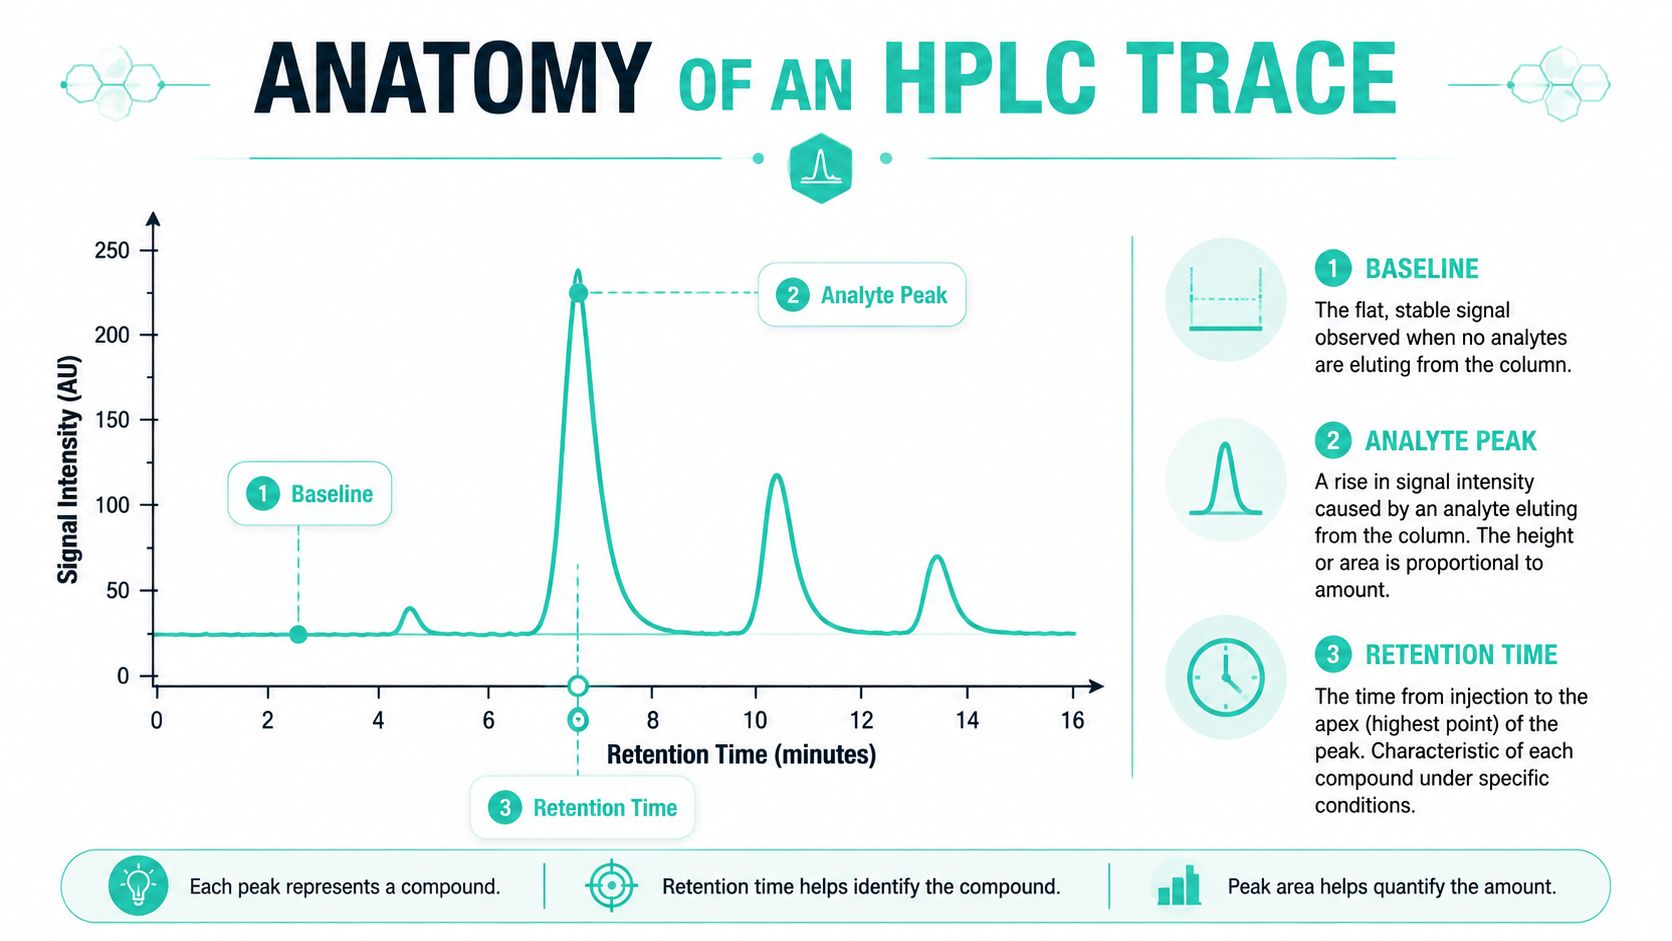
The baseline is the detector response before meaningful analyte elution. In a well-behaved run, it remains stable enough for the software or analyst to distinguish peaks from background. A drifting, noisy, or uneven baseline changes the apparent area and can create signals that look like impurities.
The first portion of a chromatogram often contains the void volume or solvent-front region. Components that don't interact meaningfully with the stationary phase can appear there, along with effects from the injection solvent or mobile-phase mismatch. That early signal shouldn't automatically be assigned to a peptide impurity.
The target analyte should then appear at a retention time established by the method. Don't identify it by position alone. Compare the retention time with a reference standard or an accepted method record, and check whether the peak shape and detector response are consistent with the expected material.
A UV trace records compounds that absorb at the selected wavelength. A diode-array detector adds spectral information across wavelengths, which can help assess whether the signal has a consistent spectrum across the peak. Mass spectrometry can provide mass-to-charge information and may reveal that a visually single peak contains more than one species, but it also requires appropriate acquisition and interpretation.
Late-eluting peaks can represent strongly retained components, hydrophobic impurities, degradation products, or material released during a wash or conditioning step. Their meaning depends on the method and controls. A useful first pass names the visible features without assigning certainty: baseline, early solvent-related signal, principal peak, shoulders, late peaks, and any drift.
The purity calculation begins with integration, not visual judgment. The software identifies where a peak begins and ends, estimates a baseline beneath it, and calculates the area enclosed by that boundary. In a simple area-percent report, each integrated peak area is divided by the total integrated area and expressed as a share of the detected signal.
That calculation is easy to perform and easy to misuse. Change the baseline, and the area changes. Move the start or end boundary, and the result changes. Merge two partially resolved components, and the software reports one combined peak unless the analyst recognizes the separation problem.
Inspect the trace at the raw-data level. Look for valley-to-valley integration between adjacent peaks, consistent treatment of shoulders, and boundaries that follow the actual baseline rather than forcing a desired result. Manual integration isn't automatically wrong, but it must be documented and scientifically justified.
Check these details:
The detector responds to chemical properties, not to grams. Peptides and related components can have different UV responses, so equal mass doesn't necessarily generate equal area. Counterions such as trifluoroacetate can also affect how an apparent chromatographic composition relates to the amount of peptide material present.
Co-elution creates a more serious limitation. If an impurity exits the column at the same time as the target, both signals occupy the same integrated region. The report can show a large main peak while concealing that mixture.
For peptide research, a 99% HPLC purity value should therefore be read as a method-specific area result unless the documentation clearly establishes something more. The number itself is listed in the supplier's report, but its meaning depends on the chromatogram, method, detector, integration rules, and any complementary assay. A quantitative assay, mass spectrometry, or another orthogonal measurement may be needed when net content or identity matters.
A peak's shape often tells you more about method health than its height. A symmetrical, narrow peak suggests controlled band dispersion, while tailing, fronting, broadening, or splitting can point to column, injection, sample, or system problems. These features also affect impurity detection because distorted peaks can overlap neighboring components.
Tailing factor and asymmetry describe how evenly a peak extends around its apex. A trailing edge can indicate secondary interactions, contamination, an aging stationary phase, or unsuitable conditions. Fronting may indicate overload or a problem with injection and sample loading. The exact calculation varies by software and convention, so the report should identify the metric being used.
Theoretical plate count is an efficiency measure. A loss of plates generally appears as broader peaks and poorer separation, though extra-column dispersion and method conditions can contribute as well. Plate count shouldn't be viewed in isolation. A high apparent efficiency for one peak doesn't rescue a method that fails to separate the target from a critical impurity.
Resolution describes how well neighboring peaks are separated. Baseline separation is often treated as a practical target around 1.5, but acceptance depends on the purpose of the method and the components being distinguished. As two peaks merge into a single hump, the area calculation becomes less informative because the integration software may not be able to assign the components reliably.
| Metric | Typical Acceptance Range | What an Out-of-Range Value Suggests |
|---|---|---|
| Tailing factor | Around 1, with a method-defined upper limit | Secondary interaction, contamination, column aging, or unsuitable conditions |
| Asymmetry | Near symmetrical peak geometry | Fronting, tailing, overload, injection effects, or column problems |
| Theoretical plates | Method-defined efficiency requirement | Band broadening, extra-column volume, poor packing, or degraded stationary phase |
| Resolution | Around 1.5 or better when baseline separation is required | Co-elution risk and unreliable impurity assignment |
Peptide methods often need to distinguish the principal sequence from closely related components, such as truncated sequences or des-Trp species. A shoulder on the main peak can be more important than a small, clearly separated late peak because the shoulder may represent partial co-elution.
A high area percentage means little if the main peak is tailing into an unresolved neighboring component.
Review peak width, symmetry, and adjacent signal together. When the peak shape changes from one run to another, investigate the system before comparing purity values.
Start with the document, not the headline number. Confirm that the chromatogram's lot identifier matches the material under review, then locate the principal peak using the stated method and reference information. Don't assume that the tallest peak is the target just because it dominates the page.
A peptide trace may also contain early solvent-related response, late-eluting hydrophobic material, and signals associated with a counterion such as trifluoroacetate. Those features need method-specific interpretation. The counterion signal shouldn't be casually counted as a peptide impurity, and a late peak shouldn't be dismissed without checking whether it appears consistently and whether the method is designed to retain and detect it.

A shoulder on the main peak deserves attention. It may indicate a related sequence, degradation product, or another component that the method only partly resolves. Zoom into the raw trace and inspect whether the integration algorithm treated the shoulder as a separate peak or absorbed it into the main area.
An unusually wide principal peak can indicate degradation products, column overload, poor efficiency, or excessive system dispersion. Width alone doesn't identify the cause, but it weakens confidence in a simple area-percent interpretation because broad signal is more likely to overlap nearby components.
Missing blank-run evidence leaves carryover unresolved. A previous injection, strongly retained material, or contaminated flow path can generate a signal in the next run. A blank trace helps show whether an apparent impurity belongs to the sample or the system.
A COA should connect the lot to the analytical record and state the HPLC purity method. When the decision has meaningful experimental or procurement consequences, request the raw chromatogram, integration report, and relevant system-suitability information rather than relying only on a summary table.
For material requiring stronger identity confirmation, HPLC-MS analysis provides a complementary line of evidence. It doesn't replace careful chromatography review, but it can help test whether the principal signal is consistent with the expected molecular mass.
Not every bump is an analyte. Baseline drift, noise, ghost peaks, negative peaks, solvent-front effects, air bubbles, and pressure disturbances can all appear in a chromatogram and may still be integrated by software. The raw trace and the run context matter more than the visual drama of an isolated signal.
A ghost peak that recurs at the same retention time in blank injections points toward the system, carryover, contamination, or mobile-phase components. A signal that appears only after a particular sample may still be real, but it needs comparison with blanks and replicate injections. Baseline drift can arise during gradient mixing or detector equilibration, while a pressure spike may reflect a restriction, bubble, or transient flow problem.
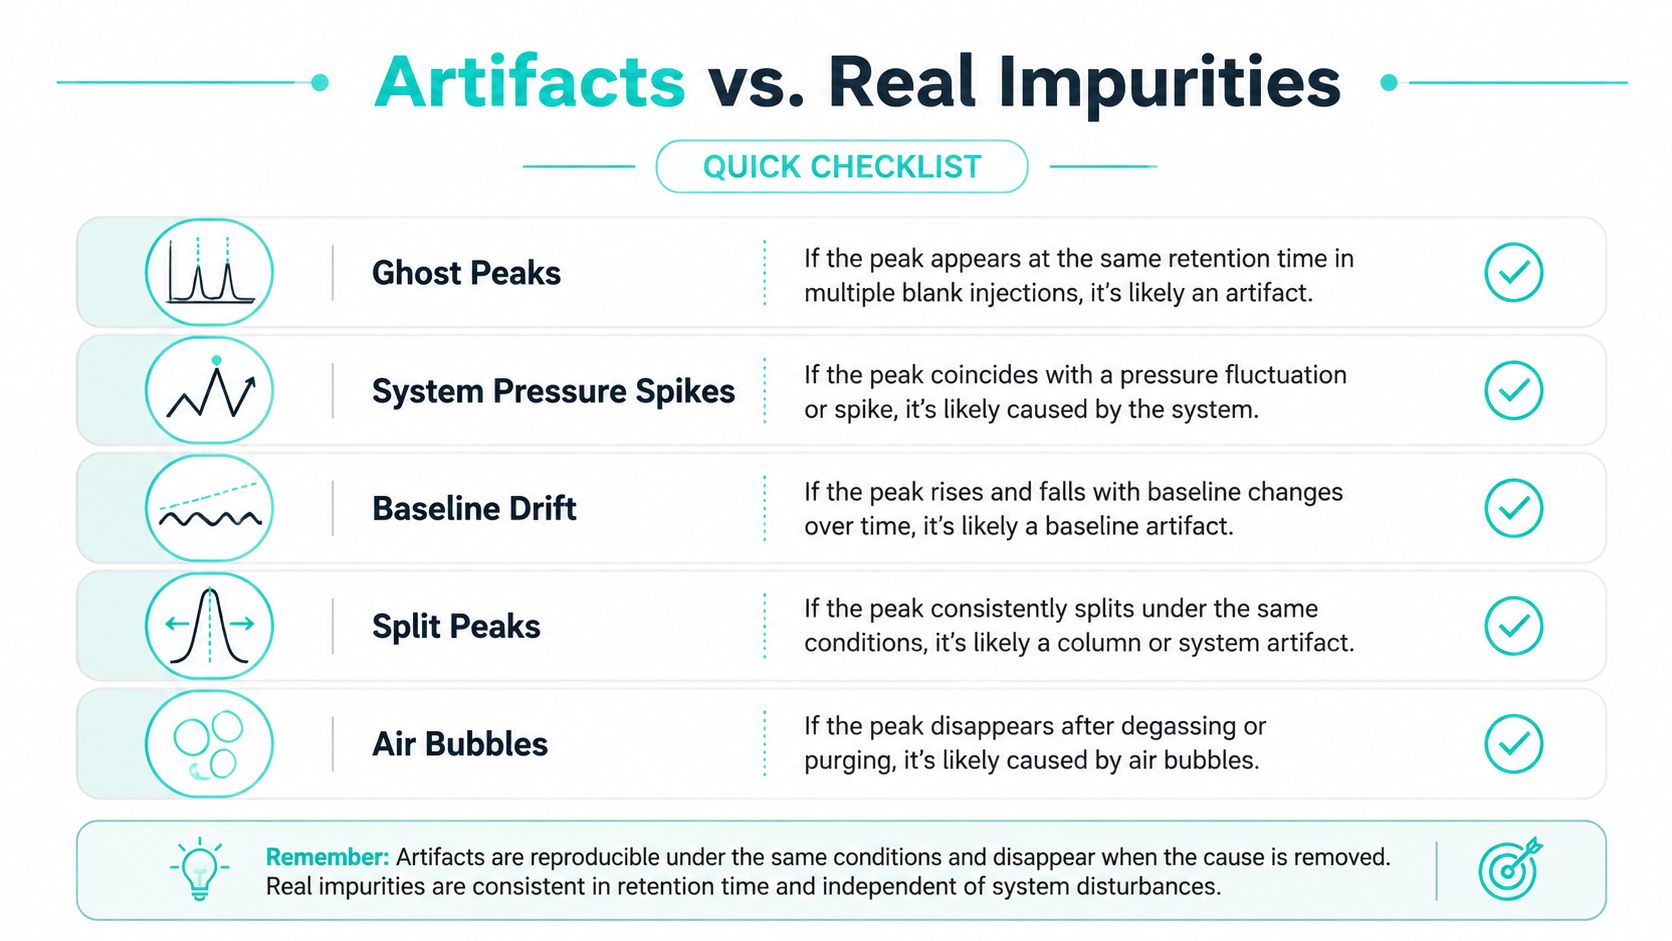
Run a blank using the same injection and gradient conditions. Prepare fresh mobile phase where contamination or additive mismatch is plausible, condition the column, and check whether the feature persists. If the apparent impurity follows the sample, survives repeat injections, and appears in a chemically plausible region, confidence increases, but it still isn't proof of identity.
A negative peak can result from a mismatch between sample solvent and mobile phase or from detector response effects. Air bubbles can create sharp disturbances, unstable baselines, and pressure irregularities. A split peak may reflect incomplete dissolution, injection problems, solvent-strength mismatch, or a defect at the column inlet.
For more demanding investigations, diode-array peak-purity checks or mass spectrometric detection can test whether a peak has consistent spectral or mass behavior across its profile. That moves interpretation beyond “the line looks clean” and toward evidence that can distinguish a single component from unresolved signal. The peptide impurity profiling methods guide offers a useful context for treating unexpected peaks as an investigation rather than an automatic impurity assignment.
System suitability is the method's contract with the instrument. Before interpreting a sample trace, confirm that the system produces acceptable retention behavior, peak shape, efficiency, separation, and injection precision under the stated conditions. If suitability fails, a polished chromatogram still deserves caution.
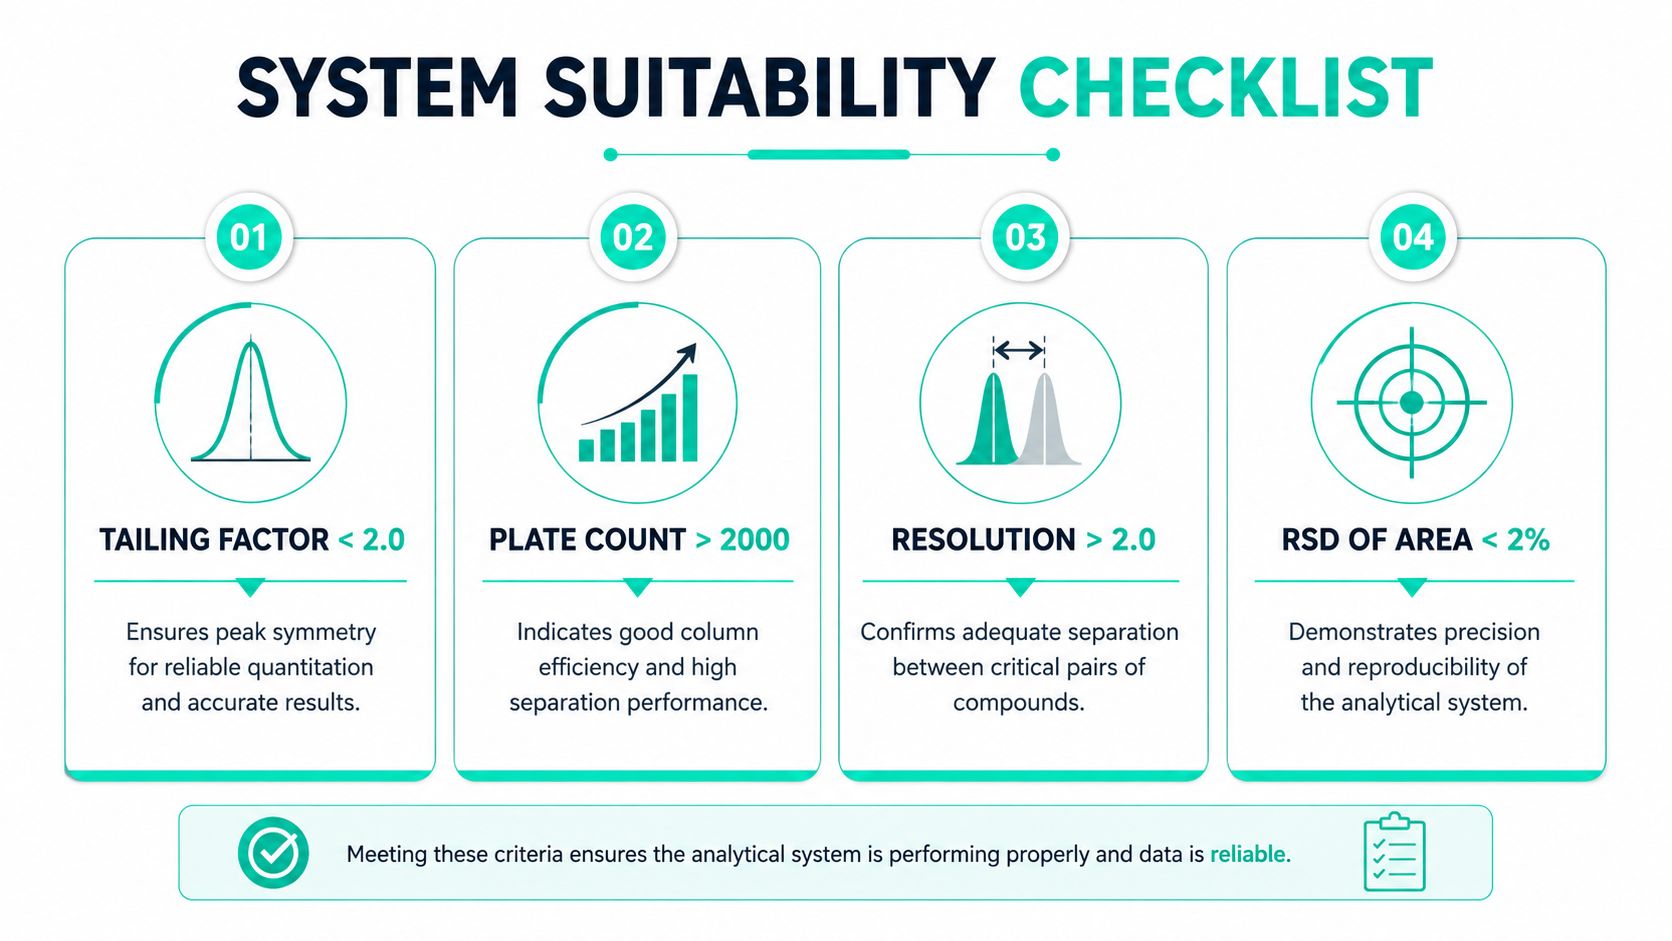
Use this review sequence:
A chromatogram is evidence, not a verdict. Read what it demonstrates, identify what it can't demonstrate, and make procurement or experimental decisions only after the method and supporting records withstand that inspection.
Celonyx Labs supplies research peptides through its online catalog and presents product quality information including stated purity and independent third-party testing. For peptide documentation and raw chromatogram questions, visit Celonyx Labs and contact the team before placing an order.
A five-residue sequence can look simple on paper, but what exactly does “5 amino acid”

Can bacteriostatic water be used more than once? Yes, if labeled multidose. Learn the 28-day

How long can peptides sit in a syringe before use? No universal time applies. Learn
FOR RESEARCH USE ONLY. Products sold by Celonyx Labs are intended exclusively for laboratory and scientific research. They are not intended for human or veterinary use, consumption, diagnosis, treatment, cure, or prevention of any disease. By purchasing from this site, you acknowledge that you understand the intended research purpose of these materials and agree to comply with all applicable laws and regulations.