

What Does Third Party Tested Mean for Research Peptides
The most popular advice about peptide purchasing is also the least useful: “Look for a

You reconstitute a research peptide for a binding assay, load the plate, and watch the baseline drift. The kit gets blamed first. Then the controls fail, the result refuses to reproduce, and a closer look reveals no visible precipitate at all. The likely problem is early aggregation, often introduced during thawing, dilution, or a freeze-thaw cycle.
That's why peptide aggregation analysis shouldn't be treated as a single-technique assay. Monomers, soluble oligomers, protofibrils, and mature fibrils can coexist, and each stage demands a different measurement. A useful workflow starts with triage, asks what species could be present, and then pairs methods that expose different weaknesses. For background on how test outputs fit into broader peptide quality checks, see this guide to peptide test results.
A junior researcher usually notices aggregation only after it has damaged an experiment. The peptide looked clear after reconstitution, the concentration was recorded, and the sample went straight into a functional assay. Yet invisible oligomers may already have changed the effective monomer concentration, altered binding behavior, or increased nonspecific interactions. A standard purity result may still look acceptable because chemical purity and physical state answer different questions.
The practical mistake is treating “no visible particles” as “no aggregates.” Early species can remain soluble and escape routine visual inspection. They can also be unstable, shifting during dilution, warming, adsorption to plastic, or contact with assay components. By the time a cloudy solution or pellet appears, the sample may already have passed through several analytically important states.
Practical rule: Decide which aggregation stage matters before choosing the instrument. A method that detects fibrils well may tell you little about weakly associated oligomers.
At the monomer stage, the question is whether the peptide remains predominantly soluble and correctly dispersed. At the oligomer stage, you're asking whether dimers, higher assemblies, or rapidly exchanging species are changing the sample's behavior. At the fibril stage, morphology and amyloid-associated structure become central.
A single readout can blur these distinctions. Fluorescence kinetics may show a delayed or accelerated signal without identifying the species responsible. Light scattering may flag a large-particle tail without telling you whether it represents a compact oligomer, a fibril bundle, or a preparation artifact. Electron microscopy can show convincing structures but samples only a small fraction of the solution and doesn't provide a straightforward population measurement.
The need for multimodal analysis has deep roots. A 1999 Journal of the American Chemical Society study showed that combining NMR with time-resolved laser spectroscopy provided a more complete view of peptide aggregation than either method alone. Fluorescence could measure at lower concentrations and observe monomeric species, while NMR supplied regional mobility information through nuclear relaxation times, an analytical logic that remains useful for difficult monomer-oligomer equilibria (JACS study on multimodal peptide aggregation analysis).
Before repeating the assay, record the sample history and classify the immediate question:
That checklist keeps the investigation anchored to a decision. It also prevents a common waste pattern, running the same assay repeatedly while never identifying what the assay can and can't measure.
Each workhorse method observes a different physical property. DLS sees diffusion through hydrodynamic size. SEC separates by apparent size. MALS estimates molar mass from scattered light. AUC resolves sedimentation behavior and self-association. TEM provides direct images. Fluorescence assays track dye response or intrinsic signal over time.
SEC is often the practical starting point for a separation-based profile because it's fast and reproducible. The important qualification is that SEC findings should be confirmed with an orthogonal method, such as SV-AUC, MALS, or AF4. Weakly associated species can dissociate during chromatography, and peptides can interact with the column matrix, so a clean chromatogram isn't automatically proof of a monomer-only sample (SEC and orthogonal confirmation for aggregate analysis).
| Method | What It Measures | Detection Range | Sample Requirement | Key Limitation |
|---|---|---|---|---|
| DLS | Diffusion-derived hydrodynamic size and distribution | Soluble particles through larger assemblies | Dilute, clean solution in a low-volume cuvette or plate | Strongly biased by large scatterers and doesn't identify morphology |
| SEC | Elution separation by apparent hydrodynamic size | Monomer through species that remain intact on the column | Enough sample for injection and recovery monitoring | Column interactions and dilution can alter weak equilibria |
| MALS | Light-scattering signal coupled to separation | Separated species with adequate scattering response | SEC-compatible sample and calibrated detector system | Requires careful concentration and refractive-index handling |
| SV-AUC | Sedimentation behavior, size distribution, and self-association | Monomers, oligomers, and weakly associated species in solution | More material and specialized instrumentation | Slower, technically demanding, and sensitive to model selection |
| TEM | Direct visual evidence of fibrils, bundles, and amorphous material | Assemblies retained on the grid and visible after staining | Very small deposited sample volume | Non-quantitative, preparation-dependent, and not representative by itself |
| ThT or intrinsic fluorescence | Dye-binding or intrinsic fluorescence changes during aggregation | Kinetic changes associated with selected species or environments | Low-volume assay format with matched controls | Signal can be affected by dye chemistry, quenching, and buffer composition |
DLS is valuable as a rapid screen, but don't reduce it to a single Z-average. Save the autocorrelation function, intensity distribution, count rate, and repeatability across acquisitions. A small amount of large material can dominate intensity-weighted output and make a mostly monomeric sample look broadly heterogeneous.
For molecular-weight confirmation, SEC-MALS is more informative than SEC alone because the light-scattering detector adds an estimate that doesn't rely only on column calibration. If the analytical question involves weak association or species that may not survive passage through a column, SV-AUC is usually more revealing. For direct morphology, TEM is useful, but a dried, stained grid is not a complete representation of solution structure.
Fluorescence remains efficient for kinetics. ThT, taBODIPY, and AN-SP can provide lag-time and comparative aggregation profiles, but fluorescence alone doesn't establish oligomer identity. For mass-sensitive peptide work, laboratories may also pair chromatography with HPLC-MS analysis when chemical identity and aggregate-associated species need to be considered together.
Most misleading aggregation results begin before the sample reaches the instrument. The preparation record should include the starting material, solvent, buffer, concentration, temperature history, number of freeze-thaw events, storage format, and time between reconstitution and measurement. Without that history, you can't tell whether a difference reflects peptide behavior or handling.
Concentration is a trade-off. Dilute samples may push oligomers below the practical detection limit, while concentrated solutions can accelerate association during preparation. Run a deliberate dilution series when the result is ambiguous instead of assuming the highest-concentration measurement is the most representative.
Buffer composition matters just as much. pH and ionic strength change electrostatic interactions, while DMSO, arginine, detergents, salts, and other co-solutes can alter solubility or interfere with optical measurements. Use buffer-matched blanks for fluorescence and scattering, and verify that the final solvent composition is the same across standards, controls, and samples.
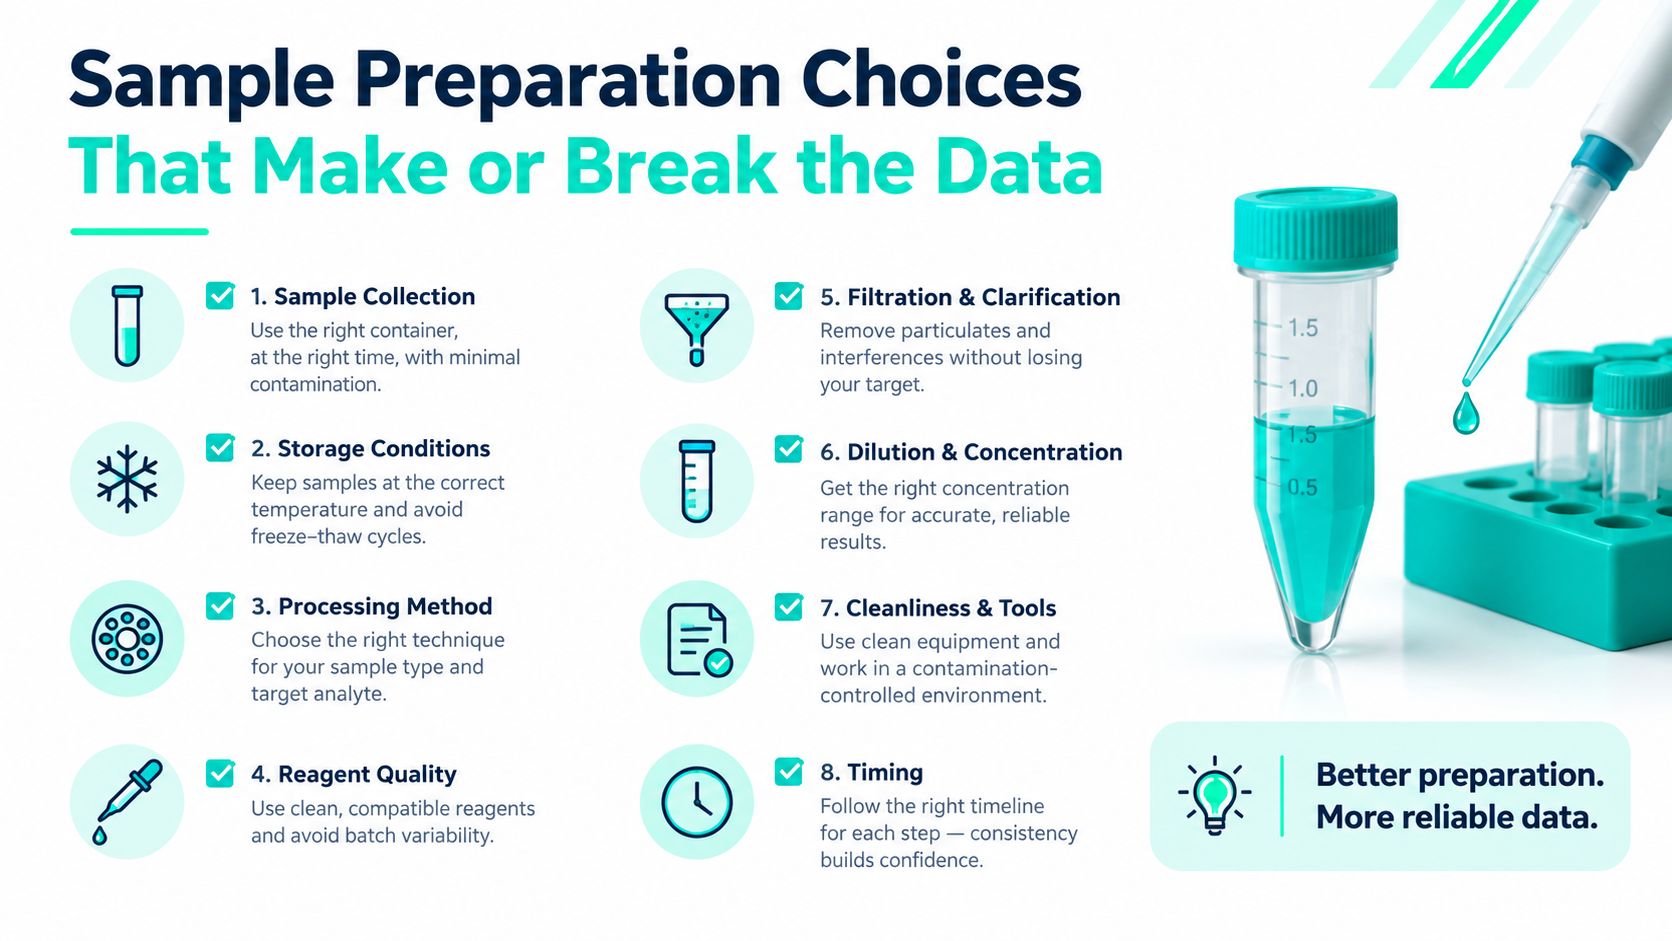
Warm the sample consistently and avoid leaving it at room temperature while preparing a long batch. Repeated freeze-thaw cycles can create a different aggregation profile from a freshly reconstituted aliquot, even when both samples appear clear. Working aliquots reduce repeated handling and make the comparison traceable.
Storage format also changes what you measure. A lyophilized peptide, a frozen stock, and a refrigerated working solution aren't interchangeable starting states. Document whether the material was reconstituted directly into the assay buffer or first dissolved in a compatible organic solvent, and use a controlled, gradual addition strategy rather than creating local zones of very high peptide concentration.
For practical handling details, compare the preparation record with this guide to how to reconstitute peptides. If DLS shows unexpected polydispersity, first inspect the preparation sequence before changing the instrument settings. Ghost peaks in SEC and crowded TEM grids often reflect precipitation, adsorption, excess stain, salt deposits, or incomplete equilibration rather than a new biological species.
A defensible workflow escalates only when the first result raises a specific question. Start with the least disruptive screen, preserve enough sample for confirmation, and record raw outputs rather than only pass or fail conclusions.
Check the solution under consistent lighting and record any haze, threads, film, or visible particles. A UV absorbance check can help identify concentration inconsistency or strong baseline problems, but it won't prove that the sample is aggregation-free. Remove obvious particulate contamination only if the study design permits it, and record whether filtration or centrifugation was used because those actions can remove real aggregates.
Run replicate acquisitions and save the correlation data. Review intensity and volume or number representations where the software supports them, because a minor large-particle population can dominate the intensity view. If the distribution changes sharply between replicates, inspect dust control, bubbles, cuvette cleanliness, concentration, and sample equilibration before interpreting the peptide.
If the sample appears monodisperse and the functional assay is stable, DLS may be enough for an initial screen. If the result is broad, multimodal, or concentration-dependent, move to separation or sedimentation rather than forcing a single size value into a quality conclusion.
SEC can distinguish material that elutes separately, while MALS adds molecular-weight information across the peaks. Compare retention time, peak shape, recovery, and detector response. A new early-eluting feature deserves investigation, but so does a disappearing shoulder, since weak assemblies may dissociate during dilution or interact with the stationary phase.
Orthogonal confirmation matters most when the result changes a release, comparability, or dosing decision.
Use SV-AUC when weak association, reversible oligomerization, or column instability is central to the question. Use TEM or AFM when you need to know whether the material forms fibrils, amorphous particles, rings, or larger bundles. Imaging should use consistent grid preparation, staining, drying, and imaging conditions.
If the concern is nucleation or growth, add a fluorescence time course with matched blanks and a controlled temperature profile. A capillary Taylor dispersion analysis method has quantified β-amyloid speciation, including monomer consumption and oligomer or protofibril populations, in about 3 minutes per run using approximately 100 μL samples (capillary TDA and fluorescence for early aggregation). That makes TDA useful when the sample is scarce and the composition is changing quickly.
Repeat at lower concentration when the signal disappears at dilution, test buffer effects when the result changes with formulation, and make orthogonal confirmation essential when DLS, SEC, fluorescence, and functional data disagree.
A lag time is not a universal measure of “stability.” It reflects the time required for a detectable signal to develop under a particular concentration, temperature, seed state, buffer, probe, and analysis threshold. A longer lag can indicate slower nucleation, but it can also reflect lower assay sensitivity or a species that the probe doesn't report efficiently.
The same caution applies to the growth phase. The slope of a fluorescence curve combines several processes, including formation, elongation, secondary nucleation, dye binding, and signal saturation. Compare curves only when the assay conditions and analysis model are consistent. If the project needs a mechanistic conclusion, support kinetics with a size or speciation method.
An SEC trace with a small high-molecular-weight shoulder shouldn't be dismissed automatically. Its importance depends on recovery, reversibility, biological use, and whether the peak persists under an orthogonal method. DLS can exaggerate the apparent importance of rare large particles because scattering intensity is strongly influenced by particle size, whereas MALS or AUC can provide a different weighting of the population.
TDA is particularly useful when the key question is how monomer depletion relates to oligomer or protofibril formation. It gives a species-oriented complement to fluorescence, which may report a structural or dye-binding event without resolving every population.
TEM and AFM can distinguish broad visual categories such as fibrillar, amorphous, annular, or bundled assemblies. They can't, by themselves, establish the concentration of each species in the original solution. Drying, adsorption, staining, flattening, and grid selection can reshape what you see, so a striking micrograph shouldn't override contradictory solution measurements.
A large-scale 2024 analysis of 21,050 aggregating short peptides found approximately 41.6% formed fibers, 35.3% formed spheres or possibly vesicles, and 23.1% formed intermediate shapes such as rods, sheets, or nets (large-scale statistical analysis of peptide aggregation morphology). The result is a useful reminder that aggregation has multiple morphological outcomes. Your own morphology claim should therefore combine imaging with a solution-based method and consistent preparation conditions.
| Method | What It Reveals | Common Overinterpretation |
|---|---|---|
| Fluorescence kinetics | Relative timing and signal development under defined conditions | Treating lag time as an intrinsic material constant |
| DLS | Hydrodynamic-size behavior and large-particle sensitivity | Calling a broad intensity distribution a specific oligomer class |
| SEC | Separable apparent-size populations and recovery | Assuming every peak reflects a stable solution species |
| MALS | Molecular-weight information across separated material | Treating detector output as proof of morphology |
| AUC | Sedimentation behavior and reversible association | Assigning stoichiometry without checking model fit |
| TEM or AFM | Visual architecture and assembly appearance | Inferring native solution structure from dried or adsorbed material |
Contradictory results are common because the methods perturb the sample differently. SEC dilutes and exposes the peptide to a matrix. DLS weights large scatterers heavily. Fluorescent dyes bind selectively and can alter the system. TEM removes the sample from solution conditions altogether.
Suspect column interaction, sample adsorption, altered equilibrium, or an injection artifact. Run a buffer blank, check retention with a suitable reference, monitor recovery, and couple the separation to MALS when possible. If the apparent aggregate peak has an unexpected molecular-weight response or poor recovery, don't label it a stable oligomer until the interaction is investigated.
Run peptide-only, dye-only, buffer-only, and matrix-matched blanks. Aromatic residues, formulation components, and contaminants can quench or enhance fluorescence. Confirm the trend with a second probe or a nonfluorescent method, because ThT or ANS response alone doesn't establish that fibrils formed.
That result may mean the sample is monomeric, but it may also mean the oligomer population is below the scattering contrast, masked by concentration, or unstable during acquisition. Repeat with a controlled dilution series, longer acquisition, fresh cuvettes, and careful dust control. Compare the raw autocorrelation curves, not only the reported size.
Temperature mismatch is another frequent cause of disagreement. Let buffers, samples, and instrument components equilibrate under the same conditions. Avoid aggressive sonication unless it's part of a validated preparation step, because energy input can fragment assemblies or create transient dispersions that disappear before the next measurement.
Diagnostic rule: Change one variable at a time. If you dilute, change the buffer, warm the sample, and sonicate it in the same experiment, you won't know which action caused the new profile.
Aggregation data becomes useful when it changes what the laboratory does with a lot. A research group can track the SEC profile, DLS distribution, fluorescence behavior, and, where relevant, AUC or imaging results as a lot-specific analytical fingerprint. The fingerprint should include preparation history, instrument settings, raw traces, and the decision made from the result.
Avoid universal acceptance cutoffs when the intended use differs. An in vitro binding assay may tolerate a different profile from a biophysical study designed to measure self-association. Material intended for animal dosing demands a documented rationale for physical-state control, formulation compatibility, and handling stability. The threshold should come from the assay's sensitivity and biological purpose, not from a generic purity label.
| Method | Metric | In Vitro Assay | Biophysical Study | Animal Dosing |
|---|---|---|---|---|
| SEC or SEC-MALS | Monomer, aggregate, and recovery profile | Define a profile compatible with the assay response | Require tighter lot comparability and orthogonal review | Require documented physical-state and formulation suitability |
| DLS | Distribution shape and repeatability | Use as a rapid screen for unexpected large material | Trend changes across concentration and storage conditions | Use alongside formulation and stability controls |
| SV-AUC | Sedimentation distribution and reversible association | Apply when oligomers may affect function | Use when stoichiometry or weak association is central | Apply when solution behavior could affect exposure or tolerability |
| Fluorescence kinetics | Lag time and curve shape | Compare only under matched assay conditions | Pair with speciation or structural methods | Use as supportive evidence, not a standalone release test |
| TEM or AFM | Fibrillar, amorphous, or other morphology | Escalate when morphology affects assay interpretation | Use for structural confirmation with solution data | Use when visible or high-order assemblies require investigation |
When a lot behaves differently, ask the supplier about synthesis, purification, storage, and reconstitution conditions. If the issue appears after handling rather than on receipt, revise aliquoting and thawing procedures instead of treating the supplier as the only variable. A defensible record connects the observed profile to the use decision and preserves the evidence for future lot comparisons.
Celonyx Labs supplies research peptides through its online catalog and describes 99% purity and independent third-party testing as product quality attributes. For laboratories that need peptide material alongside their own aggregation workflow, visit Celonyx Labs to review available research peptides and contact options.
Before your next assay, record the sample history, run a fast physical-state screen, and reserve enough material for an orthogonal confirmation. If your data still disagree, compare the stage each method measures rather than choosing the most reassuring result.
The most popular advice about peptide purchasing is also the least useful: “Look for a

Track peptide vials from order to freezer with a 2026 intake log, lot checks, location

Build a spreadsheet workflow that logs peptide reconstitution calculations automatically in 2026 — auto-calculate concentration,
FOR RESEARCH USE ONLY. Products sold by Celonyx Labs are intended exclusively for laboratory and scientific research. They are not intended for human or veterinary use, consumption, diagnosis, treatment, cure, or prevention of any disease. By purchasing from this site, you acknowledge that you understand the intended research purpose of these materials and agree to comply with all applicable laws and regulations.