

Best GHK-Cu peptides for skin and wound healing research 2026
Choose the best GHK-Cu peptide format for laboratory skin and wound-healing research. Compare documentation, assay
You've just received a new peptide, opened the vendor's email, and found a Certificate of Analysis attached as a PDF. Near the top, a bold purity value looks reassuring. Then you notice a chromatogram, a mass spectrum, and several method notes that seem harder to interpret than the headline result.
A useful COA doesn't answer one question. It provides a bundle of complementary evidence about what's in the vial, how much of it appears to be the intended peptide, and what the analytical methods may have missed. This guide walks through peptide test results as a senior analytical chemist might review them with a new lab buyer, including what to accept, what to question, and what to do when the evidence doesn't line up.
You are reviewing a new peptide lot when the COA presents a reassuring purity figure, followed by chromatographic data, mass measurements, and method notes. The useful question is not whether one result looks good. It is whether several independent observations support the same conclusion.
A peptide COA usually addresses different quality questions. Reversed-phase HPLC estimates chromatographic purity, LC-MS supports molecular identity, and separate tests may assess residual solvents, water, counterions, endotoxins, or other contaminants. Each method examines a different property, so one cannot stand in for the rest.
Read the report by separating four questions:
Reversed-phase HPLC separates compounds by their interactions with the column and solvent system. Analysts integrate the resulting peaks to calculate the reported purity. The peptide purity testing guidance describes this measurement as a core quality-control metric because it can distinguish the intended compound from synthesis byproducts and degradation products.
LC-MS examines a separate piece of evidence. It checks whether material associated with the principal chromatographic signal has the expected mass. A clean HPLC trace without matching MS support could belong to a dominant compound other than the peptide ordered. The reverse is also possible. An expected mass does not show whether related impurities or non-ionizing contaminants remain in the vial.
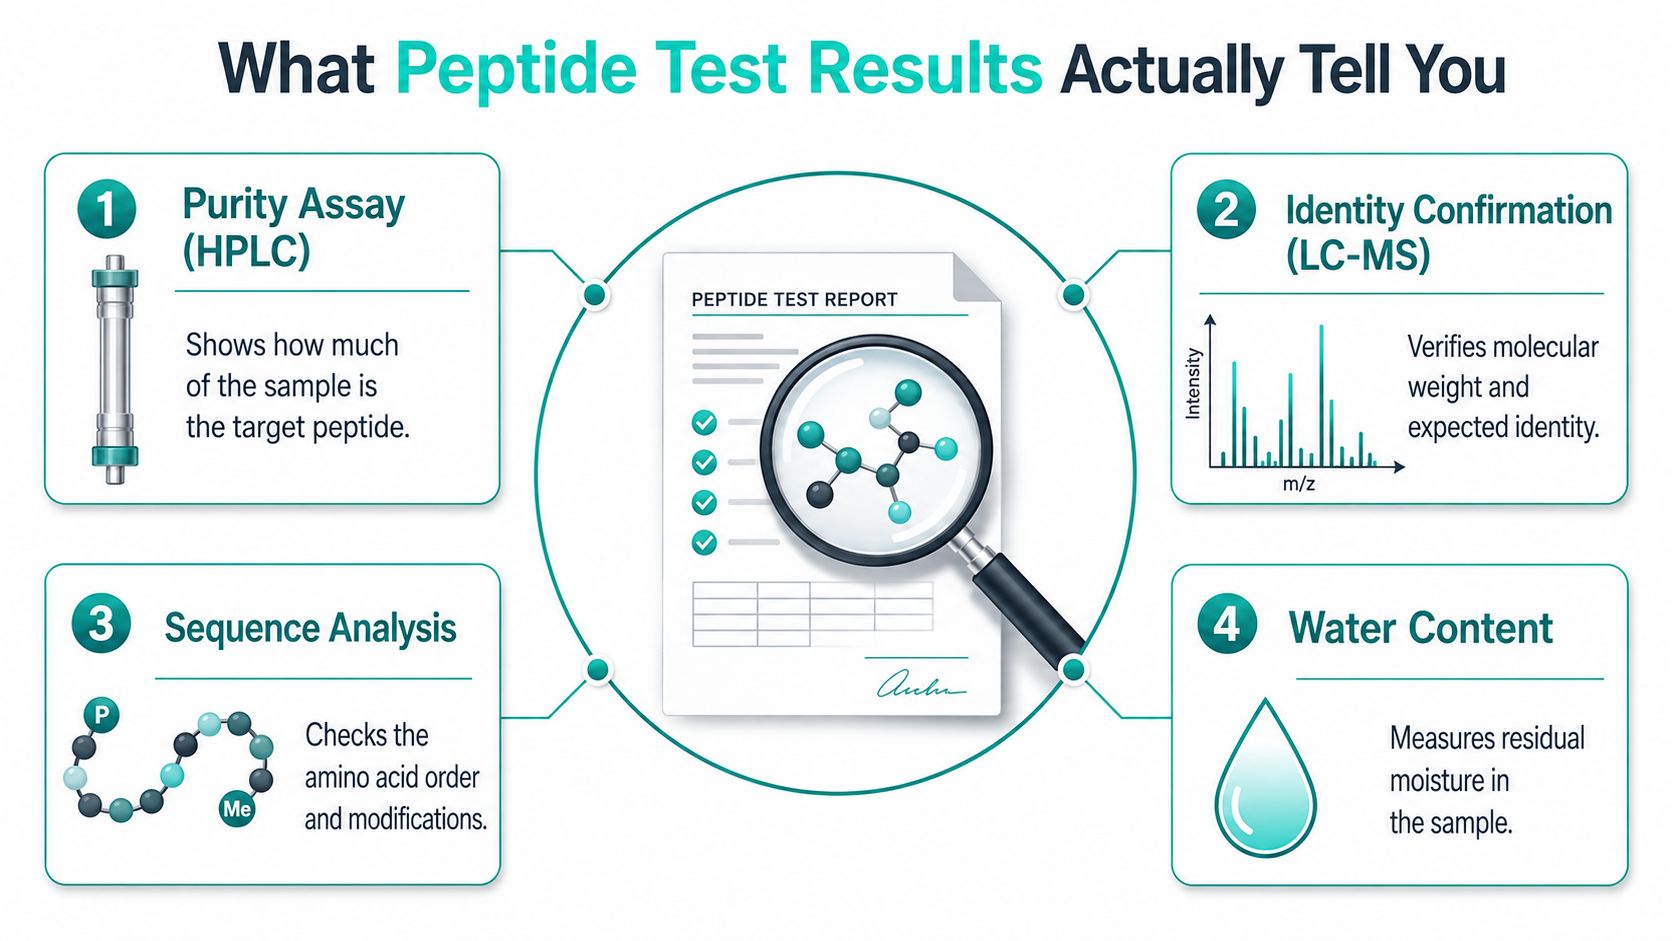
Confidence increases when the methods agree. HPLC describes separation behavior and relative peak abundance, while LC-MS connects a peak with molecular mass. High-resolution LC-MS can provide greater selectivity where closely related impurities are difficult to distinguish with UV detection alone, as discussed in this peer-reviewed analysis of peptide characterization.
A high chromatographic purity value still has boundaries. Water, counterions, and synthesis solvents affect the vial's actual mass composition, even when they do not change the headline area percentage. Before accepting a lot for a sensitive experiment, compare the chromatogram, mass spectrum, lot identifier, and contaminant testing. If those records conflict, verify that the documents belong to the same lot, request a retest or independent confirmation, and ask the vendor to explain the discrepancy before use.
Practical rule: Treat the purity percentage as the starting point for review, not a final verdict on suitability.
A lab buyer opens a COA and sees a high purity percentage beside a crowded chromatogram. The number is encouraging, but it is only one piece of evidence. Reversed-phase HPLC separates sample components by how long they interact with the column packing and solvent system. The detector records each component as it elutes, producing peaks that can be compared with one another.
Read the chromatogram in this order:
That calculation describes relative chromatographic area. It does not necessarily represent the percentage of the vial's total mass that is intact peptide. Water, counterions, and residual solvents can contribute to the vial's mass without appearing as separate UV-detected peptide peaks.
Use the reported value as a screening point, then match it to the experiment. General screening may tolerate roughly 70% to 80% purity. Validation and follow-up studies typically call for greater than 90% to 95% purity, while material above 98% purity is often targeted for in vivo or pharmaceutical-adjacent work. These are practical ranges, not universal release rules. The required level depends on assay sensitivity, downstream use, and the consequences of carrying impurities into the experiment.
Inspect the trace, not only the headline. Check the baseline and integration boundaries. A shoulder beside the main peak can indicate a closely related impurity or incomplete separation. Fronting may reflect overloading or sample and method problems. Late-eluting signals can point to strongly retained hydrophobic species or degradation products. Integration settings, baseline placement, and detector conditions can change the reported area, so a clear chromatogram is more informative than an isolated percentage.
For a visual explanation of these features, consult this guide to interpreting HPLC chromatograms.
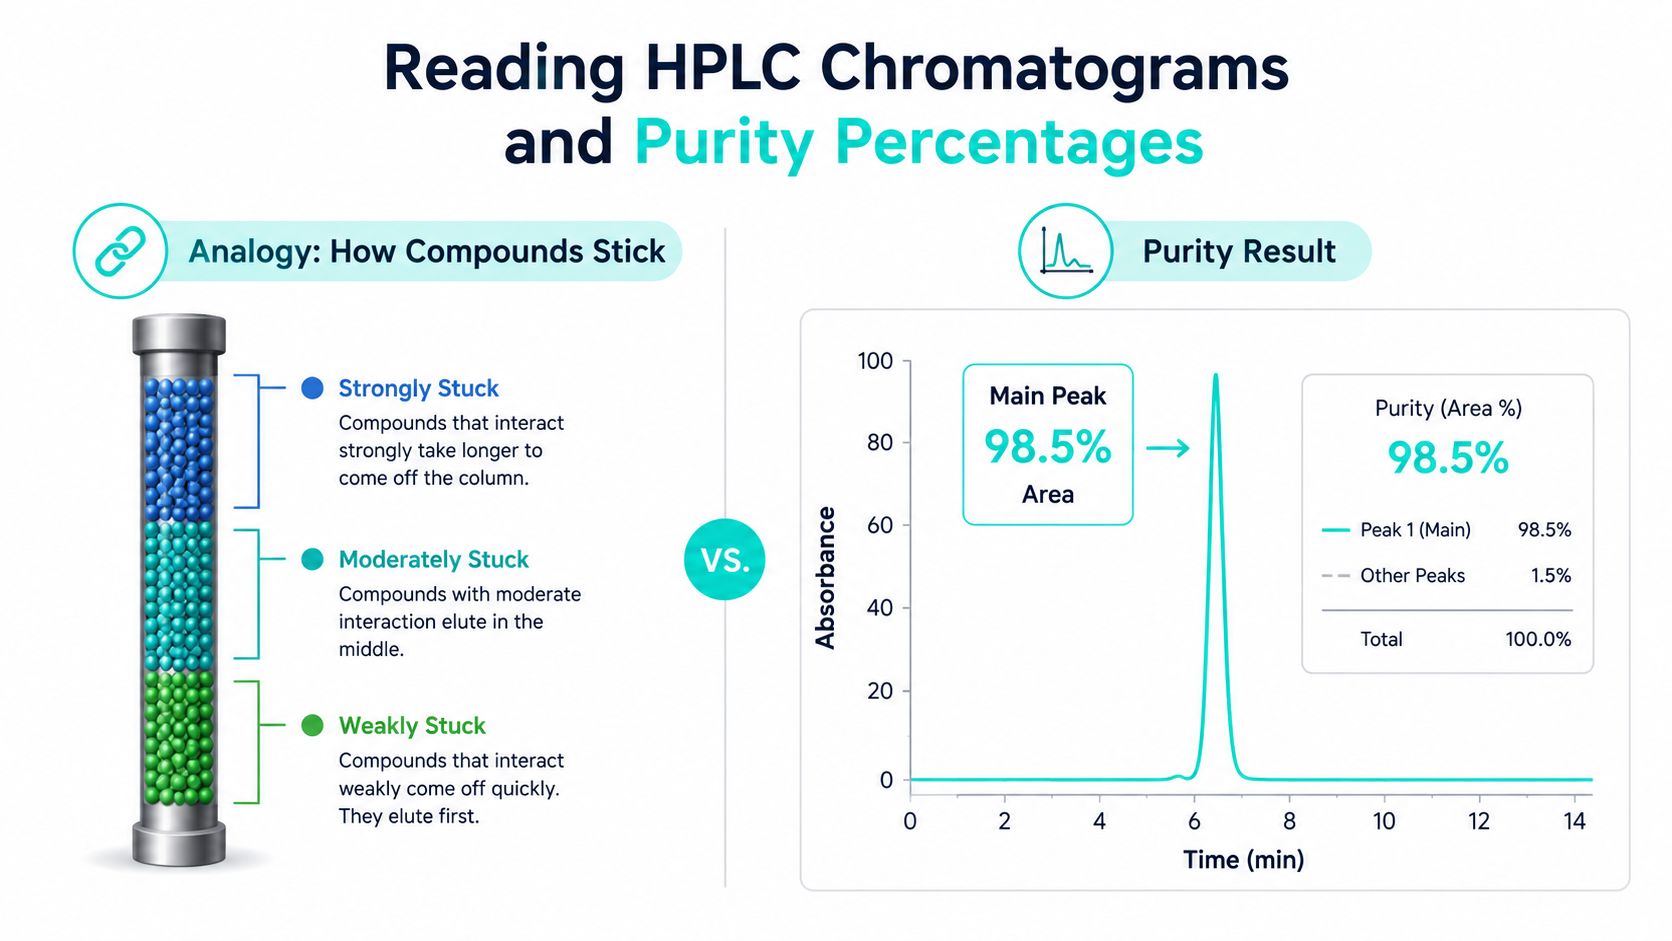
A dominant, well-resolved peak supports the lot's quality, but it does not establish molecular identity. Review the chromatogram alongside the other test results, and verify the lot number if any document appears inconsistent.
A COA may show a strong HPLC peak, yet the vial could still contain the wrong peptide. Mass spectrometry adds a second kind of evidence by measuring the mass-to-charge ratio, written as m/z, of ionized molecules. Because peptides can carry different charge states, an observed m/z value does not always equal the neutral molecular mass. Analysts interpret the ion pattern and compare it with the mass calculated for the ordered sequence.
LC-MS connects separation with identity. HPLC shows where components separate in time, while MS indicates whether the principal component has the expected mass. The LC-MS analysis overview explains why these methods complement each other rather than substitute for one another.
Start with the expected ion assignment. The report may list a singly charged ion, a multiply charged ion, or a deconvoluted molecular mass. Compare the observed and calculated values using the laboratory's stated tolerance and interpretation method. If the report does not explain which value is being compared, ask for clarification before accepting the assignment.
Look for an isotopic envelope, a related group of signals produced by naturally occurring isotopes. Its pattern supports the presence of a molecular species with the expected composition. A matching mass strengthens the identity assignment, but it does not show that every molecule in the vial has that identity.
Unexpected signals need context. A mass shift can be associated with oxidation, dehydration, adduct formation, a counterion, a truncated sequence, or another modification. The mass difference alone cannot establish which explanation applies. Analysts also need the peptide sequence, sample preparation details, ionization conditions, and the accompanying chromatographic profile.
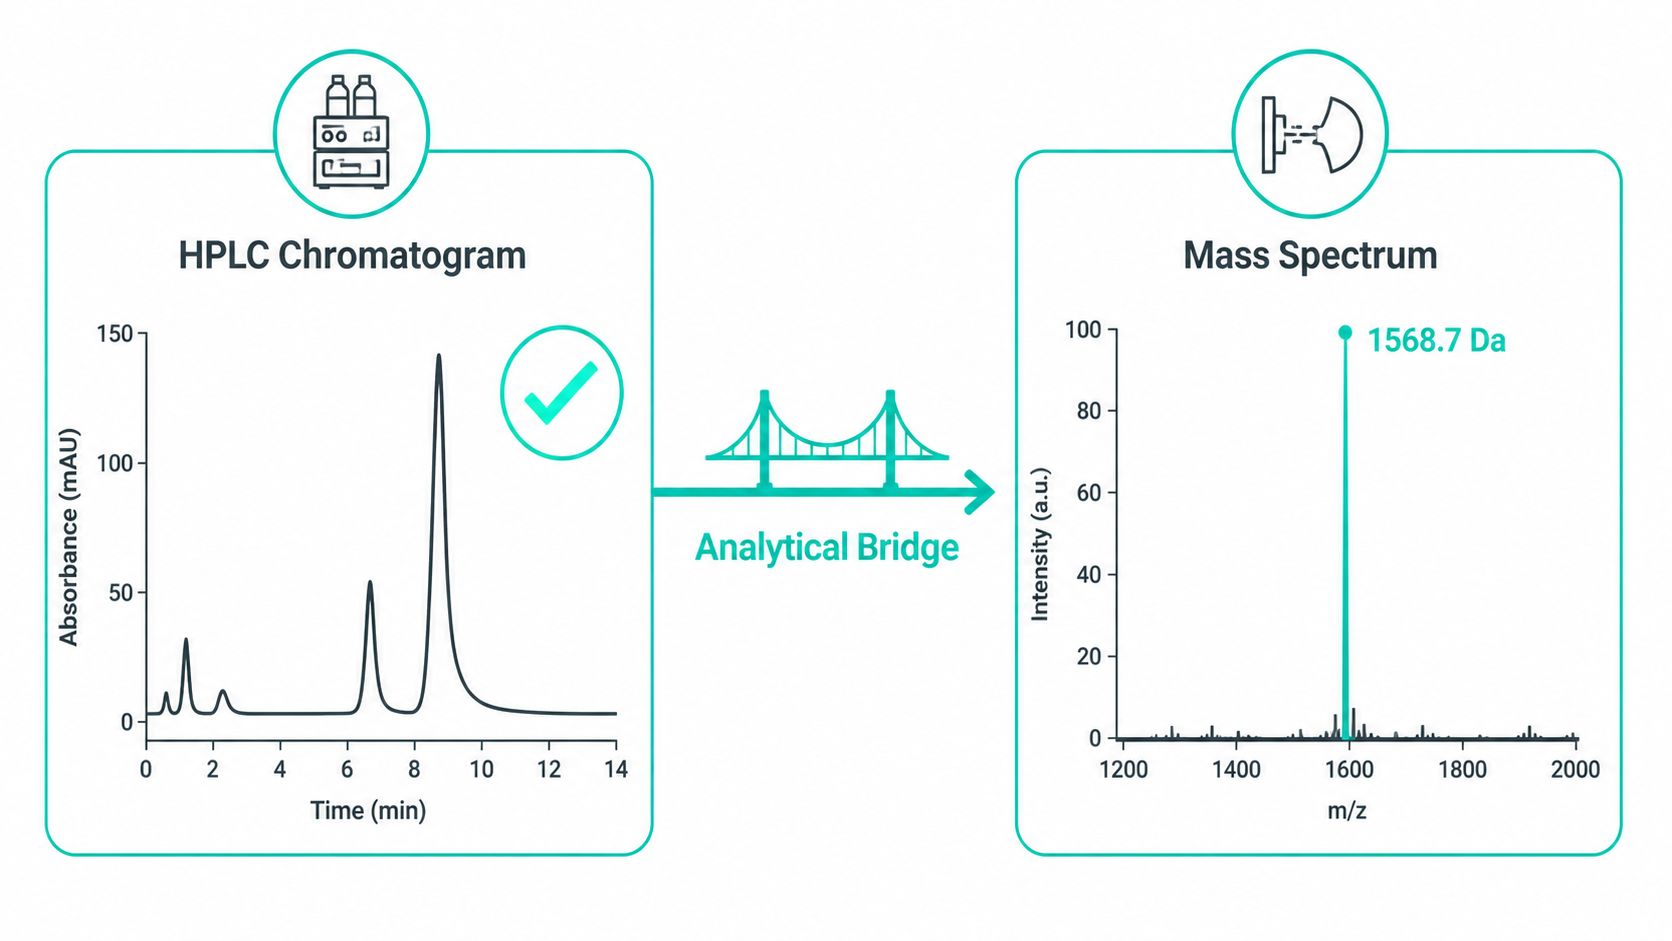
MS can support the identity of the dominant molecular species, but it does not provide the HPLC purity percentage. Substances that ionize poorly, or that do not enter the instrument under the selected conditions, may appear weaker or remain undetected. A reliable interpretation therefore considers the spectrum and chromatogram together.
The strongest result is a well-resolved principal HPLC peak paired with an MS signal consistent with the expected mass, without unexplained secondary masses corresponding to prominent chromatographic impurities. If those findings disagree, pause the experiment. Verify the lot, request a retest when appropriate, and ask the vendor or testing laboratory to explain the discrepancy before escalating the issue.
Read the COA from the top down. The first task isn't judging the purity number. It's proving that the document belongs to the vial in your hand.
Check the product name, sequence or identifier, lot number, vial label, synthesis date, release date, and any expiry or retest information. A result without a lot number can't be reliably tied to a specific manufacturing run. A document that lists a different lot from the vial should be treated as unresolved until the vendor corrects it.
Next, check whether the document distinguishes between synthesis and testing dates. Peptide test results are more useful when they reflect the material released, stored, and shipped, rather than an unrelated reference sample.
For HPLC, look for the column type, mobile phases, gradient, flow rate, injection information, and detector wavelength. Those details affect retention and integration. A bare statement such as “HPLC purity” provides far less context than a method with an attached chromatogram.
For MS, identify the ionization approach, instrument or analyzer information, mass range, and whether the report gives calculated and observed values. The report should make clear whether the stated mass is a direct ion assignment or a deconvoluted value.
Then examine the result itself:
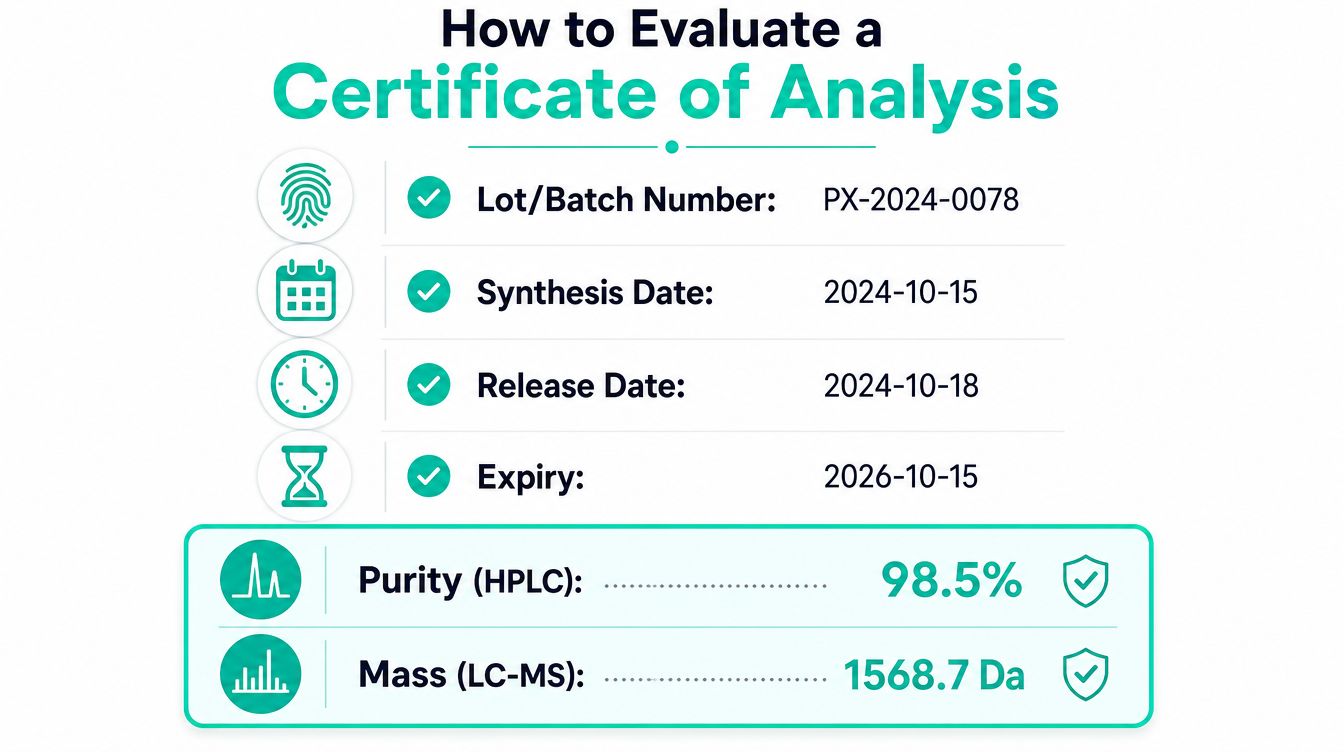
Be cautious when the COA omits the lot number, gives no testing date, provides a vague method, lacks instrument or analyst information, or reports purity without the underlying chromatogram. A signature or approval field helps establish document control, but it doesn't replace the analytical data.
A vendor that provides third-party-tested peptides should still be able to identify the tested lot and explain what the external laboratory measured. “Third-party tested” is useful only when the report is specific enough for you to evaluate.
Unexpected peptide test results become easier to diagnose when you compare the HPLC pattern, MS evidence, and handling history instead of focusing on one abnormal value.
A sample can show the expected molecular mass while still containing a substantial group of related impurities. In solid-phase peptide synthesis, incomplete coupling can create deletion sequences, while premature termination can produce truncated products. These species may remain chemically similar to the target and may complicate biological interpretation.
The review of synthetic peptide impurities identifies deletion and insertion sequences as important synthesis-related impurity classes. A correct mass for the principal species therefore doesn't clear the entire batch. Review the impurity pattern and ask whether the minor peaks have been identified.
A shoulder suggests that the principal signal may contain a second species that the method only partly resolves. Closely related sequences, isomers, modified products, or stereochemical variants can behave similarly in chromatography. If the MS result shows more than one related mass, the evidence for heterogeneity becomes stronger.
Poor resolution can also arise from the method itself. A different column chemistry or adjusted gradient may separate species that appear merged under the original conditions.
An observed mass that doesn't match the expected value can reflect a chemical modification, adduct, counterion, oxidation, dehydration, or truncated sequence. Don't assign a specific mechanism from a numerical difference without checking the sequence and sample preparation.
The most useful response is to compare the unexpected mass with the chromatogram. A distinct secondary HPLC peak carrying the shifted mass is more informative than an isolated MS signal with no retention-time context.
Residual solvent findings can indicate incomplete drying or insufficient removal during workup. Storage can introduce a different problem. Moisture uptake, aggregation, repeated freeze-thaw exposure, or chemical degradation may create a purity trend that changes over time even when the original synthesis was acceptable.
Record the vial condition, storage history, reconstitution solvent, and handling steps. A fresh retest can help distinguish a release problem from a storage or preparation problem.
A purity number is a starting point, not a universal pass or fail rule. Set the evidence required by the experiment, then assess the lot as a bundle of purity, identity, and supporting tests.
| Research purpose | Min. HPLC purity | Identity required | Key additional QC |
|---|---|---|---|
| General screening | Roughly 70% to 80% | Yes, preferably LC-MS | Review major impurity peaks and handling suitability |
| Validation and follow-up studies | Greater than 90% to 95% | Yes, LC-MS | Impurity profile and relevant residual-solvent review |
| In vivo or pharmaceutical-adjacent work | Often above 98% | Yes, with orthogonal confirmation | Contaminant testing and fuller batch characterization |
For early screening, a lower purity tier can suit an exploratory assay when the material's identity is confirmed. Review impurities anyway. A minor component may alter the biological readout, like adding an unknown reagent to a control. The resulting signal could reflect the contaminant rather than the intended peptide.
Validation and follow-up studies generally call for a cleaner, better-characterized lot. Researchers need to separate biological variation from differences between materials. Compare the COA's lot number, chromatogram, identity result, and impurity profile with the specification agreed before purchase.
In vivo or pharmaceutical-adjacent work requires broader evidence. A high HPLC value should sit alongside identity confirmation and separate consideration of contaminants, water, counterions, and residual process materials. Purity describes the chromatographic composition under a defined method. It does not, by itself, establish suitability for every use.
Record the acceptance criteria before the vial arrives. If a result falls short or looks inconsistent, verify the lot, preserve the raw documentation, and retest before deciding whether to use or escalate the material.
When peptide test results look wrong, don't begin with an accusation or an expensive investigation. Use a documented decision path that starts with the simplest explanation and preserves the evidence if the problem proves real.
Compare the vial label with the COA product name and lot number. Check for transcription errors, missing pages, unexplained revisions, absent signatures, and a chromatogram or spectrum that appears to belong to another sample. Review the vendor's product reference information, but don't treat a general reference document as proof for your specific lot.
Batch-specific documentation and lot matching are central to a reliable verification workflow, as described in this guide to verifying peptide quality. If the vendor can't connect the report to the exact vial, pause the material's use until the discrepancy is resolved.
If the paperwork is consistent but the result remains suspicious, retest the material in-house or through an independent laboratory. Use a fresh mobile phase, inspect the column history, and consider a different HPLC column or gradient. For identity, request a separate LC-MS run rather than relying on the original spectrum.
Document the sample preparation, dilution, instrument, method, analyst, and raw files. That record lets you compare results without confusing an instrument artifact, carryover, integration choice, or preparation error with a genuine batch defect.
If the retest confirms the discrepancy, contact the vendor in writing. Include the lot number, sample handling history, chromatograms, spectra, method conditions, and a concise description of the mismatch. Ask for lot-specific raw data, an explanation of the assigned peaks, and a defined resolution such as purification, replacement, or additional testing.
Escalate formally when the vendor disputes a well-supported finding or when the same issue appears across lots. Keep the correspondence with your procurement records. A clear paper trail protects future experiments and helps your lab decide whether the supplier's documentation meets its quality requirements.
Celonyx Labs supplies research peptides through its online catalog and describes independent third-party testing and stated purity information for its products. Visit Celonyx Labs to review available materials and contact the team about lot-specific peptide test results before placing your order.
Choose the best GHK-Cu peptide format for laboratory skin and wound-healing research. Compare documentation, assay

Choose lot-verified melanotan 1 peptide for pigmentation research. Compare material specifications, purity evidence, and documentation

Native oxytocin peptide is the default for behavioral research. Compare reference standards, labeled materials, and
FOR RESEARCH USE ONLY. Products sold by Celonyx Labs are intended exclusively for laboratory and scientific research. They are not intended for human or veterinary use, consumption, diagnosis, treatment, cure, or prevention of any disease. By purchasing from this site, you acknowledge that you understand the intended research purpose of these materials and agree to comply with all applicable laws and regulations.